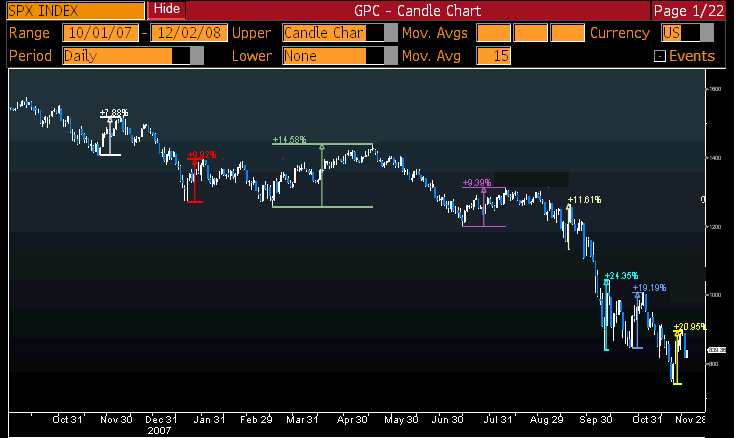
Merrill Lynch’s David Rosenberg notes that last week’s pop was the eighth bear market rally since October 2007.
As the chart below shows, they have ranged in strength from ~8% to over 24%.
Each one was treated (”enthusiastically”) as if a bottom had been made. Each one saw a subsequent lower low, excepting the most recent one that ended Friday.
These included:
- The TAF (S&P 500 at 1500)
- January 75 bp rate cut (1325)
- The Bear Stearns deal in March (1270)
- The fiscal package in April (1200)
- The GSE conservatory in July (1200)
- The TARP in October (1180)
- Pre-election Rally (840)
- The Citi bailout in November (750)
Rosenberg added late Sunday:
This is now a five-day rally that has seen the S&P 500 surge 19%. Then again, we did see a 7-day rally tally up to 18.5% from late October to early November. And before that a 4-day rally in mid-October that netted equity traders an 8.5% spike. What is happening is that the bear market rallies are getting shorter and more flashy – but they are still bear market rallies. The ones we have seen thus far in this bear market have seen the S&P 500 rise nearly 10% and last 18 days on average. These are rallies, in our opinion, that investors should using as an opportunity to sell into.
>
Bear Market Rallies, October 2007 to November 2008
chart courtesy of FusionIQ, Bloomberg


 狗仔卡
狗仔卡 发表于 2008-12-2 07:32 PM

 提升卡
提升卡 置顶卡
置顶卡 沉默卡
沉默卡 喧嚣卡
喧嚣卡 变色卡
变色卡


 发表于 2008-12-2 11:16 PM


