|
|
What happens to the S&P 500 after a long run above its 50 day moving average comes to an end?
Background information: On March 9th, the S&P 500 had been trading above its 50 day moving average for 130 consecutive days. Since 1960, this has occurred only 8 times. On March 10th, the S&P 500 closed beneath its 50 day moving average.
The Rules:
Buy if S&P 500 has been trading above the MA50 for 100 days or more and today it closes beneath the MA50.
Sell X days later.
All buys and sells made at the close.
No commissions or slippage added.
Testing begins in 1960.
Results:
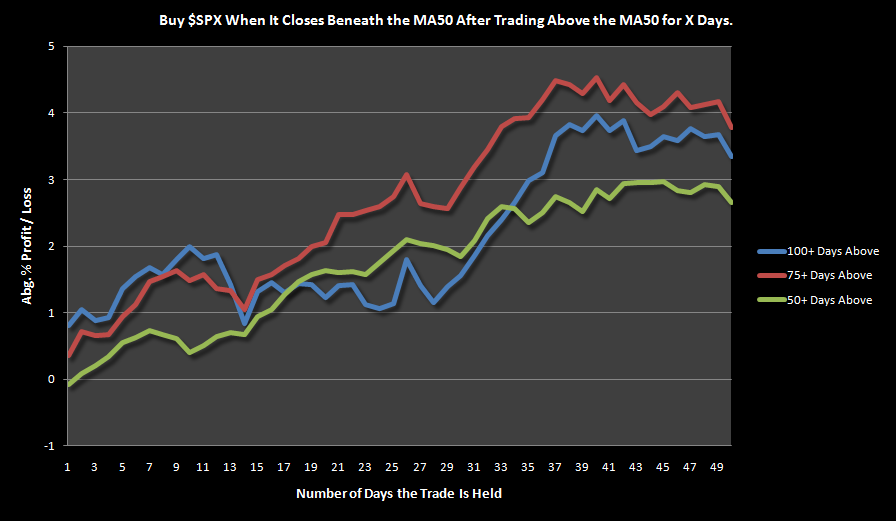
First, I added additional factors to the test to see what happens with a larger sample size. There were 18 previous instances of the $SPX trading above its MA50 for 75 or more days and 51 instances of 50 or more days.
What jumped out at me was that the the next day’s returns are good for the 75+ and 100+ models at 0.37% and 0.82%, respectively. The win rate for the next day’s returns is high at over 77% for 100+ days and over 63% for 75+ days or more.
Past history shows that a significant bounce usually occurs almost immediately following this setup.
Results at the intermediate time frame of 50 trading days are soundly bullish. |
|

 狗仔卡
狗仔卡 发表于 2011-3-13 07:22 PM
 提升卡
提升卡 置顶卡
置顶卡 沉默卡
沉默卡 喧嚣卡
喧嚣卡 变色卡
变色卡