SummaryHere's a look at how the DG50 progressed from Q2 of 2015 to Q2 of 2016.
While income growth was adequate, total return left the S&P 500 Index (and numerous dividend-related funds) in the dust.
Incredibly strong performers included Realty Income, Altria and WEC Energy.
Had you told me on June 30, 2015, that the Dividend Growth 50 would outperform the market over the next 12 months, I might have responded, "I hope so." Had you told me the DG50 would practically quadruple the total return of the S&P 500 Index, I probably would have laughed in your face.
I mean, what other silly notion could you have advanced back then? The bombastic reality show host who had just announced his candidacy for president actually would emerge as the presumptive Republican nominee? Come on!

Well, for better or worse, we now know the latter turned out to be true: Donald Trump shouted down foe after foe... and, unless there is a "Dump Trump" uprising at the GOP convention, he'll oppose Hillary Clinton in a nasty showdown between perhaps the two least-popular presidential candidates ever.
And I'm here to tell you that the former is true, too. The DG50, selected by a panel of Seeking Alpha contributors who mostly use the Dividend Growth Investing strategy, crushed the Vanguard S&P 500 ETF (NYSEARCA:
VOO) during the 12-month stretch ending June 30, 2016.
Using $25,000 of my own money, I funded an equally weighted portfolio of DG50 companies in December 2014. At the same time, for comparison's sake, I also bought positions in Vanguard Dividend Appreciation ETF (NYSEARCA:
VIG), Vanguard Dividend Growth Fund (MUTF:
VDIGX) and VOO.
April-to-June 2015 was the first quarter since the DG50 was established in which every component paid a dividend. Therefore, Q2 2016 is the first quarter in which accurate year-over-year comparisons could be made.
Here, in Table 1, are the relevant total return numbers:
ENTITY | POSITION VALUE 6/30/15 | POSITION VALUE 6/30/16 | INCREASE |
DG50 | $25,324.81 | $29,390.55 | 16.05% |
VOO | $574.96 | $598.32 | 4.06% |
VIG | $476.82 | $519.58 | 8.97% |
VDIGX | $5,145.15 | $5,615.01 | 9.13% |
| | | |
If I didn't see it happening all year with my own eyes, I wouldn't have believed it possible.
But the surprise doesn't end there, folks. As illustrated in Table 2 below, VOO grew its dividends nearly twice as strongly as the DG50 did!
ENTITY | DIVIDENDS PAID APRIL-JUNE 2015 | DIVIDENDS PAID APRIL-JUNE 2016 | INCREASE |
DG50 | $204.27 | $212.83 | 4.21% |
VOO | $2.73 | $2.95 | 8.06% |
VIG | $2.68 | $2.77 | 3.36% |
VDIGX | $46.06 | $42.60 | (-7.51%) |
| | | |
Interestingly, as you can see in the above table, a highly regarded fund with "Dividend Growth" right in its name actually saw its second-quarter income decline 7.51% year-over-year. (I still like VDIGX and own some in a personal account. Most income-focused stock funds simply don't have the same kind of reliable, repeatable dividend growth as proven, "DGI-type" companies.)
Show Me The Divvies
Here is the dividend growth information for each DG50 component. In Table 3below, the companies are listed in order of their year-over-year income increases.
COMPANY | DIVIDENDS PAID APRIL-JUNE 2015 | DIVIDENDS PAID APRIL-JUNE 2016 | INCREASE |
| $4.26 | $5.66 | 32.86% |
| $1.93 | $2.44 | 26.42% |
| $4.44 | $5.36 | 20.72% |
| $3.43 | $4.10 | 19.53% |
| $0.96 | $1.13 | 17.71% |
NextEra Energy (NYSE: NEE) | $3.88 | $4.52 | 16.49% |
Omega Healthcare (NYSE: OHI) | $7.15 | $8.24 | 15.24% |
| $3.53 | $4.04 | 14.45% |
| $3.38 | $3.86 | 14.20% |
Lockheed Martin (NYSE: LMT) | $4.53 | $5.14 | 13.47% |
| $5.25 | $5.94 | 13.14% |
Dominion Resources (NYSE: D) | $4.57 | $5.14 | 12.47% |
Becton, Dickinson (NYSE: BDX) | $2.41 | $2.70 | 12.03% |
| $2.69 | $3.00 | 11.52% |
| $2.61 | $2.91 | 11.49% |
| $3.93 | $4.38 | 11.45% |
| $3.09 | $3.44 | 11.33% |
| $3.66 | $4.06 | 10.93% |
Automatic Data Processing (NASDAQ: ADP) | $2.94 | $3.26 | 10.88% |
| $3.54 | $3.90 | 10.17% |
| $2.81 | $3.09 | 9.96% |
Johnson & Johnson (NYSE: JNJ) | $3.78 | $4.15 | 9.79% |
| $3.08 | $3.38 | 9.74% |
| $6.35 | $6.98 | 9.61% |
| $3.96 | $4.34 | 9.60% |
Walgreens Boots (NASDAQ: WBA) | $2.37 | $2.57 | 8.44% |
| $6.30 | $6.83 | 8.41% |
| $4.29 | $4.64 | 8.16% |
| $5.49 | $5.95 | 8.38% |
| $3.14 | $3.39 | 7.96% |
Kimberly-Clark (NYSE: KMB) | $3.52 | $3.80 | 7.95% |
| $4.43 | $4.78 | 7.90% |
| $7.15 | $7.71 | 7.83% |
| $6.12 | $6.58 | 7.52% |
| $6.07 | $6.50 | 7.08% |
| $3.22 | $3.44 | 6.83% |
| $3.73 | $3.98 | 6.70% |
| $4.42 | $4.71 | 6.56% |
United Technologies (NYSE: UTX) | $2.57 | $2.72 | 5.84% |
Colgate-Palmolive (NYSE: CL) | $2.67 | $2.81 | 5.24% |
| $5.90 | $6.20 | 5.08% |
| $5.40 | $5.67 | 5.00% |
Emerson Electric (NYSE: EMR) | $3.79 | $3.97 | 4.75% |
Procter & Gamble (NYSE: PG) | $4.01 | $4.19 | 4.49% |
| $3.40 | $3.54 | 4.12% |
General Electric (NYSE: GE) | $4.64 | $4.80 | 3.45% |
| $3.63 | $3.73 | 2.75% |
| $3.64 | $1.31 | (-64.01%) |
ConocoPhillips (NYSE: COP) | $5.90 | $2.12 | (-64.07%) |
| $6.31 | $1.73 | (-72.58%) |
| | | |
TOTALS | $204.27 | $212.83 | 4.21% |
In his most recent article,
A Warning For Dividend Growth Investors, Eric Parnell discussed some risks facing DGI practitioners, especially those who have not yet endured a correction or recession. Eric made many good points, especially about the psychology of investing, but I believe he overstated the likelihood of dividend cuts.
Last year ... total deletions were 67 out of 820 companies at risk (753 at 12/31/15, plus the 67 that had been deleted), about double the trend since 2010, when the Contender and Challenger lists were added. So the deletions were 8.2%, leaving a 91.8% "success" rate in a "bad" year.
Dave went on to say that the 2015 numbers were inflated by currency-related deletions and oil industry cuts. Just one year earlier, the deletion rate was 4.7%, meaning the success rate was 95.3%. That, he said, was more typical.
But what if there's another recession as severe as the 2007-09 version? According to Fish, about 80% of Dividend Champions grew or maintained dividends during the second-worst financial crisis ever.
As for the DG50, 94% of its components have not cut dividends and the vast majority have raised payouts. I firmly believe KMI and COP were outliers; the rest of the portfolio experienced robust 8.9% year-over-year income growth.
Total Return, Totally Impressive
Table 4 includes the dollar values of each DG50 component, listed in order of year-over-year increase.
COMPANY | VALUE 6/30/15 | VALUE 6/30/16 | INCREASE |
WEC Energy | $457.29 | $752.25 | 64.50% |
Realty Income | $499.74 | $815.88 | 63.26% |
Altria | $499.22 | $731.66 | 46.56% |
Lockheed Martin | $566.25 | $778.75 | 37.53% |
NextEra Energy | $497.79 | $682.64 | 37.13% |
Clorox | $527.27 | $718.93 | 36.35% |
McCormick | $572.55 | $769.09 | 34.33% |
Southern | $429.26 | $576.03 | 34.19% |
Kimberly-Clark | $427.37 | $571.22 | 33.66% |
Philip Morris | $493.20 | $655.07 | 32.82% |
Baxter and Shire (NASDAQ: SHPG) | $493.21 | $652.87 | 32.37% |
General Mills | $565.78 | $746.64 | 31.97% |
Hershey | $449.12 | $588.44 | 31.02% |
McDonald's | $483.81 | $631.66 | 30.56% |
AT&T | $547.64 | $702.68 | 28.31% |
Johnson & Johnson | $494.31 | $633.54 | 28.17% |
Verizon | $524.36 | $657.90 | 25.47% |
General Electric | $541.09 | $661.96 | 22.34% |
Becton, Dickinson | $571.41 | $695.82 | 21.77% |
Dominion Resources | $476.98 | $577.46 | 21.07% |
Kraft Heinz | $691.25 | $831.62 | 20.31% |
Coca-Cola | $474.64 | $570.61 | 20.22% |
Microsoft | $492.49 | $586.81 | 19.15% |
AFLAC | $503.82 | $599.64 | 19.02% |
Automatic Data Processing | $484.18 | $571.33 | 18.00% |
Genuine Parts | $450.60 | $527.51 | 17.07% |
Exxon Mobil | $507.52 | $592.99 | 16.84% |
PepsiCo | $473.32 | $553.00 | 16.83% |
3M | $468.91 | $546.72 | 16.59% |
Colgate-Palmolive | $462.77 | $529.52 | 14.42% |
Chevron | $492.38 | $561.57 | 14.05% |
Procter & Gamble | $476.87 | $533.67 | 11.91% |
Visa | $539.21 | $599.81 | 11.24% |
Starbucks | $647.66 | $699.09 | 7.94% |
Wal-Mart | $430.89 | $457.03 | 6.07% |
Omega Healthcare | $458.54 | $486.26 | 6.05% |
HCP | $412.18 | $427.99 | 3.84% |
Walgreens Boots | $595.80 | $597.71 | 0.32% |
Emerson Electric | $450.59 | $440.33 | (-2.28%) |
IBM | $495.13 | $479.47 | (-3.16%) |
United Technologies | $448.48 | $425.89 | (-5.04%) |
Caterpillar | $430.97 | $402.09 | (-6.70%) |
Qualcomm | $444.17 | $394.48 | (-11.19%) |
Target | $579.00 | $510.24 | (-11.88%) |
Wells Fargo | $512.79 | $444.23 | (-13.37%) |
Deere | $590.35 | $507.55 | (-14.03%) |
Apple | $632.14 | $491.76 | (-22.21%) |
ConocoPhillips | $502.27 | $372.12 | (-25.91%) |
Kinder Morgan | $510.20 | $261.66 | (-48.71%) |
| | | |
Cash | $0.03 | $0.01 | (-66.67%) |
| | | |
TOTALS | $25,324.81 | $29,390.55 | 16.05% |

Notes And Observations
All dividends in DG50 companies and the comparison funds were reinvested.
Information used in all four tables was lifted directly from brokerage statements.
WEC completed its acquisition of Integrys Energy, and KHC was formed by the merger of Kraft and Heinz. Those corporate actions resulted in a cash infusion into the DG50, as chronicled
HERE. That money was used to buy one share each of WEC and KHC last summer, as per portfolio rules. Take away the "extra-share" factor, and WEC's total return would have been "only" about 48% and its Q2 income growth would have been about 20%. KHC's gain would have been closer to 5% and income growth about 6.5%.
Baxter spun off its biopharmaceutical arm, Baxalta, last year. In Table 3, the amount shown in the "Dividends Paid April-June 2016" column reflects the combined income received from both companies. Baxalta has since been acquired by Shire, resulting in another cash infusion into the DG50. Those funds were used to acquire three additional shares of BAX. The "Value 6/30/2016" column in Table 4 reflects the combined value of Baxter and Shire. Without those extra shares acquired June 24, BAX would have had only a 5% gain, but the overall portfolio value would be little changed because it would have significantly more cash. No dividends have been paid on the new shares yet, so Table 3 is unaffected.
Fourteen DG50 components saw total returns in excess of 30%. Eight more topped the 20% mark, and 11 others were above 10%. In other words, two-thirds of the companies held in the portfolio experienced double-digit total returns.
Positions that had double-digit total returns in the 12-month period ending June 30 and double-digit, year-over-year income growth in the second quarter: WEC, MSFT, V, NEE, LMT, MO, D, BDX, HSY, MMM, ADP and PEP. If 9.5% and above is rounded up to 10%, add MKC, JNJ, GPC, O and KO to the list. (I didn't include KHC in this group due to the "extra-share" factor.)

Aggressive dividend growth usually is great for investors but it doesn't necessarily guarantee great price performance. CAT, QCOM, AAPL, IBM and TGT each had double-digit income growth from Q2 2015 to Q2 2016, but each position sustained losses.
Eleven companies, "led" by Kinder Morgan, suffered year-over-year losses. Only those 11 and two others (WBA and HCP) failed to outgain the S&P 500 Index.
Only three companies paid fewer dividends in Q2 2016 than they had a year earlier, but those three - KMI, COP and BAX - distributed so much less income that it affected the DG50's overall income stream quite dramatically.
That the portfolio could endure three severe cuts yet still grow its income 4% speaks to the Dividend Growth 50's strength and to the importance of diversification. Then again, that only a few cuts could seriously curb growth of the overall income stream is a reminder of the importance of buying sound companies and monitoring one's holdings. In my personal portfolio,
I sold more than half of my KMI at $34 and
divested my COP position well before the dividend cut; DG50 rules do not allow for such moves.
Despite a similarly horrid-looking dividend cut, Baxter's situation was quite different from those of KMI and COP. Baxter was involved in both a spin-off and a sale, and its combined parts actually gained 32% for the DG50. Sure, the income loss might have bothered retirees, but a 32% total return can buy a lot of divvies.
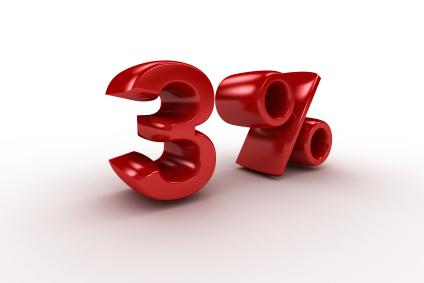
As of June 30, the DG50's yield was just shy of 3%. I figured that by taking the dividends paid in the most recent quarter ($212.83), multiplying that figure by 4 to represent a full year ($851.32) and then dividing that figure by the portfolio value ($29,390.55). The result was .02897, or 2.9%.
The advances of Utilities, Telecoms, many Consumer Staples and most REITs show just how thirsty investors have been for yield in this low-rate environment. One no longer can find 4% CDs - let alone the double-digit-rate CDs of decades past - so Realty Income, Southern, AT&T and Altria looked awfully good to investors.
Realty Income's surge to the $70 range has perplexed many who believe O stands for "Outrageously Overvalued." Morningstar, for example, likes the company and rates Realty Income's management as "Exemplary," but Morningstar's analysts have O trading at nearly a 30% premium to its net asset value. Even as many Seeking Alpha contributors and commenters have said they've trimmed their positions, O's price has kept advancing.
With the Fed disinclined to raise interest rates much (if at all), Realty Income and other well-run REITs face few headwinds these days. O truly has been an amazing story, and it's one to watch closely going forward. It is a core holding in my personal portfolio; although I am not selling, I admit I am thinking about turning off the monthly drip for the first time.
Like many Energy sector companies, COP and KMI have been laggards. High-quality integrated oil corporations had a nice comeback year, however, with the DG50's XOM and CVX positions combining to grow more than 15% - this despite XOM's smaller-than-usual dividend hike and Chevron's freeze.
A year ago, a frequently discussed topic was the troubled future of fast food and soda in our exceedingly health-conscious world. Well, McDonald's, Coke and Pepsi had such solid years that those who held are celebrating with smiling faces (if not Happy Meals). The talk now is how overpriced these stocks seem to be.
It was a mixed bag for Industrials... but as usual, high quality ruled the day. That meant another fine showing for 3M.
It wasn't the best year for the DG50's brick-and-mortar retailers, as Target lost nearly 12%, Walgreens was flat and Wal-Mart advanced only 6% after having hit the skids in 2015. The three combined to lose 2.5%, and their dividend growth slowed. (Wal-Mart had two dividend payments in Q2 2015 and two again in Q2 2016. The amounts listed in Table 3 reflect total income for each quarter.) It's not easy for these "old retail" behemoths to compete with Amazon and other online retailers. In my personal portfolio, I sold WMT in February 2015 and trimmed my TGT and WBA positions.


A fine earnings report for General Mills and a takeover bid (since rejected) involving Hershey boosted those companies' returns in the quarter's final days.
More Comparisons
VIG was hardly the only dividend-focused ETF to "lose" the total-return battle to the DG50. Others included the ProShares S&P 500 Dividend Aristocrats ETF (NYSEARCA:
NOBL), which, according to longrundata.com, gained 12.76% during the 12 months; the Schwab U.S. Dividend Equity ETF (NYSEARCA:
SCHD), 11.56%; and the WisdomTree Large Cap Dividend ETF (NYSEARCA:
DLN), 7.26%.
One combination favored by some investors, a 50/50 split of VOO and the iShares 20+ Year Treasury Bond ETF (NYSEARCA:
TLT), experienced a 12.62% total return from June 30, 2015, to June 30, 2016 - some 20% less than the Dividend Growth 50's gain.
A few ETFs did beat the DG50, including the PowerShares S&P 500 High Dividend Low Volatility Portfolio ETF (NYSEARCA:
SPHD), 24.56%; the iShares Select Dividend ETF (NYSEARCA:
DVY), 17.34%; and the SPDR Dividend ETF (NYSEARCA:
SDY), 16.34%. None has demonstrated consistent income growth over time, however.
Brexit, Schmexit!
British citizens voted to exit the European Union on June 23, and Mr. Market reacted angrily the next two sessions.
As a result, the value of my VOO position declined 4.9% from $598.93 pre-Brexit to $569.83 post-announcement.
The value of the DG50, meanwhile, fell significantly less, 2.7%, from $28,883.07 at market close 6/23/16 to $28,114.97 two sessions later.
And while VOO still hadn't recovered all of its Brexit-fueled decline by month's end, the DG50 erased the loss and ended up 1.8% higher on June 30 than it had been June 23 - the day before the panic.
In other words, what was perceived as a major negative event - maybe even a dreaded "black swan" - wreaked far less havoc upon the Dividend Growth 50 than it did upon the overall market. Plus, the DG50 recovered faster and more strongly.
Conclusion
I fully acknowledge that companies such as Realty Income, WEC Energy and Altria - can't keep up this pace indefinitely. Nevertheless, I remain convinced that DGI is a strategy that can help investors bask in the glow of sunny daysand weather the storm when clouds inevitably roll in.
In my personal portfolio, I monitor my holdings and react when necessary... while trying not to overreact. Just because Brexit or political upheaval or rate rumors or terrorist attacks make other investors freak out, the rest of us don't have to lose our collective financial cool, do we?
Maintaining the DG50 keeps me more analytical and less emotional, and that's bound to come in handy when Donald and Hillary really start slinging the mud.
Although the Dividend Growth 50 is, by design, a buy-and-hold project, I believe tracking its progress makes me a more experienced, patient and effective investor. Here's hoping others also are finding it to be a valuable endeavor.
Disclosure: I am/we are long ALL DG50 COMPANIES, AS WELL AS VOO, VIG AND VDIGX.
I wrote this article myself, and it expresses my own opinions. I am not receiving compensation for it (other than from Seeking Alpha). I have no business relationship with any company whose stock is mentioned in this article.