本帖最后由 deep 于 2020-12-16 09:29 PM 编辑
Mortgage Deferral Agreements and Their ImpactDecember 16, 2020
Our Fall 2020 Residential Mortgage Industry Dashboard discusses mortgage deferral agreements and their impact. At the end of the second quarter1, credit unions, mortgage finance companies (MFCs) and mortgage investment entities (MIEs) have allowed mortgage deferral agreements for about 6%, 7% and 7% of their respective residential mortgage portfolios. Chartered banks have allowed 16% of mortgages to go into deferral since the beginning of the pandemic. Of these, close to 2 out of 3 borrowers had resumed payments on their mortgages at the end of the third quarter of 20202. In the coming months, we could see higher delinquency rates if some borrowers are unable to resume their payments; these mortgages will have to be booked as arrears. These deferral agreements have affected financial institutions’ cash flows, with reductions of: - 4% in scheduled mortgage payments
- 3% in non-scheduled payments (accelerated monthly payments and lump-sum payments)
Cash flows from both scheduled and non-scheduled capital repayments are reduced as mortgage deferral agreements are in place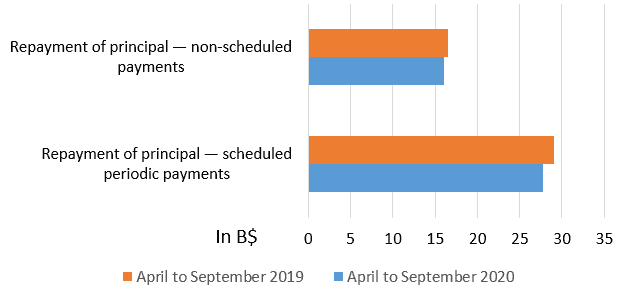 [td] [td]
| Repayment of principal — scheduled periodic payments | Repayment of principal — non-scheduled payments | April to September 2020 | 28 | 16 | April to September 2019 | 29 | 16 |
Sources: CMHC, residential mortgage data reporting of NHA MBS issuers, CMHC calculations While remaining at low levels, mortgages in arrears (90 or more days delinquent) have increased slightly between the first and second quarters of 2020 from: - 0.24% to 0.26%, on average, for chartered banks
- 0.23% to 0.25%, on average, for non-bank mortgage lenders3
We also observe an increase in early-stage delinquencies (31 to 59 days and 60 to 89 days), which suggests that arrears could continue on an upward trend. Mortgage in arrears (delinquent for 90 days and over) have increased for all lender types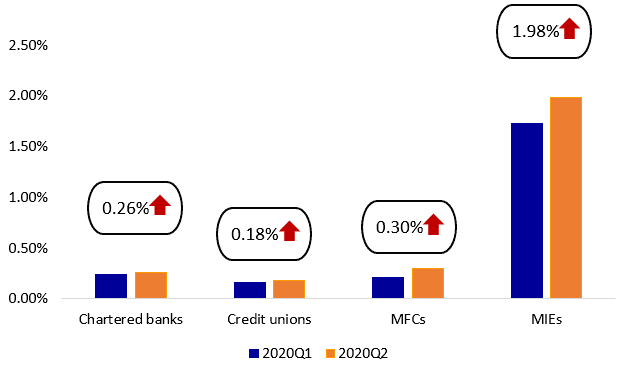 [td] [td]
| 2020 Q1 | 2020 Q2 | Chartered Banks | 0.24% | 0.26% | Credit Unions | 0.16% | 0.18% | MFCs | 0.21% | 0.23% | MIEs | 1.73% | 1.85% |
Sources: Statistics Canada (Survey of Non-Bank Mortgage Lenders, second quarter 2020) and Canadian Bankers Association (Number of Residential Mortgages in Arrears, May 2020) From January to October 2020, chartered banks reported a more than 20% increase in the total value of mortgage originations attributed to Canadian residents compared to the same period in 2019. This is mainly due to a surge in newly extended mortgages, both for property purchases and refinances. Lower interest rates, coupled with significant increases in housing prices in some Canadian markets, partially explain the increase in mortgage originations, in both numbers and value. Banks have reported increasing mortgage activity, mostly due to new mortgages for property purchases and refinances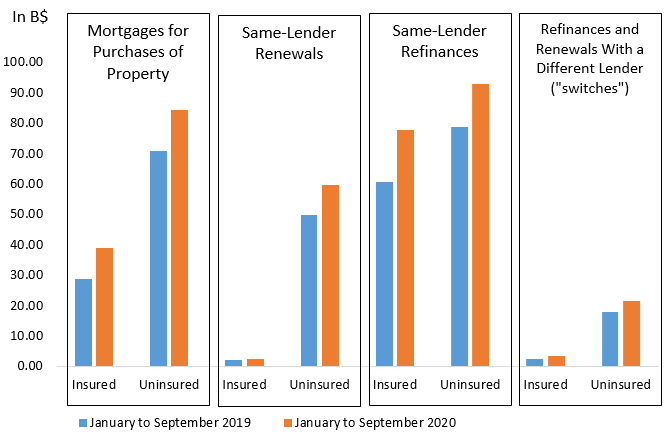 [td] [td]
| 2019 YTD | 2020 YTD | January to September 2019 | January to September 2020 | Mortgage originations for the purchases of property — Insured | 28,704,856 | 38,880,068 | 28.70 | 38.88 | Mortgage originations for the purchases of property — Uninsured | 70,856,433 | 84,158,548 | 70.86 | 84.16 | Same lender refinancing — Insured | 2,101,973 | 2,175,313 | 2.10 | 2.18 | Same lender refinancing — Uninsured | 49,665,253 | 59,637,211 | 49.67 | 59.64 | Same lender renewals — Insured | 60,641,936 | 77,612,189 | 60.64 | 77.61 | Same lender renewals — Uninsured | 78,525,165 | 92,602,677 | 78.53 | 92.60 | Other renewals/refinancing and other mortgages — Insured | 2,404,434 | 3,200,294 | 2.40 | 3.20 | Other renewals/refinancing and other mortgages — Uninsured | 17,825,299 | 21,519,737 | 17.83 | 21.52 |
Sources: CMHC, residential mortgage data reporting of NHA MBS issuers, CMHC calculations By contrast, limited mortgage issuances by the largest mortgage investment corporations in Canada during the second quarter of 2020 have resulted in slower growth from this segment: - mortgage investment corporation (0.9%)
- overall residential mortgage growth in Canada (1.3%)
The risk profile of loans issued by MICs remains relatively stable, with an average loan-to-value (LTV) ratio under 70% and around 75% being first mortgages. Interviews with a sample of MIC managers suggest mortgage investment corporations have adopted more restrictive lending, indicating a focus on capital preservation. Key metrics of top 25 MICs in Canada have remained relatively stable[td]
| Q2-2019 | Q3-2019 | Q4-2019 | Q1-2020 | Q2-2020 | Average Lending rate — Individuals | 9.2% | 9.25% | 9.28% | 9.14% | 9.31% | Average Share of 1st mortgages — Individuals | 74.53% | 74.57% | 73.43% | 75.15% | 75.48% | Average Loan-To-Value (LTV ratio) — Individuals | 57.93% | 56.43% | 56.47% | 56.65% | 56.68% | Debt to Capital | 17.23% | 15.90% | 15.70% | 14.80% | 14.39% |
Geographical distribution[td]
| Q2-2019 | Q3-2019 | Q4-2019 | Q1-2020 | Q2-2020 | BC | 37.4% | 33.15% | 34.74% | 36.23% | 36.24% | Alberta | 9.45% | 11.17% | 9.75% | 7.66% | 8.18% | Ontario | 46.46% | 49.40% | 49.18% | 49.54% | 48.47% | Quebec | – | – | 1.97% | 2.10% | 2.14% | Others | 6.76% | 6.3% | 4.34% | 4.48% | 4.57% |
Source: Fundamentals Research Corp.
|

 狗仔卡
狗仔卡 发表于 2020-12-16 09:18 PM
 提升卡
提升卡 置顶卡
置顶卡 沉默卡
沉默卡 喧嚣卡
喧嚣卡 变色卡
变色卡