|
|
From CalculatedRisk
Here is a collection of 20 real estate and economic graphs from January ...
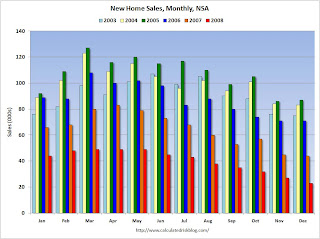 New Home Sales in December New Home Sales in December
[size=85%]Click on graph for larger image in new window.
The first graph shows monthly new home sales (NSA - Not Seasonally Adjusted).
Noticethe Red columns for 2008. This is the lowest sales for December since1966. (NSA, 23 thousand new homes were sold in December 2008, 23thousand were sold in December 1966). As the graph indicates, sales in2008 are substantially worse than the previous years. From: Record Low New Homes Sales in December
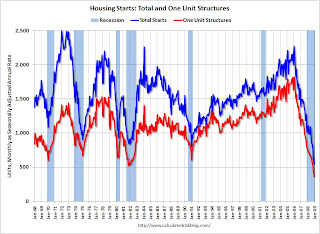 Housing Starts in December Housing Starts in December
Totalhousing starts were at 550 thousand (SAAR) in December, by far thelowest level since the Census Bureau began tracking housing starts in1959.
Single-family starts were at 398 thousand in December;also the lowest level ever recorded (since 1959). Single-family permitswere at 363 thousand in December, suggesting single family starts mayfall even further next month. From: Housing Starts at All Time Low
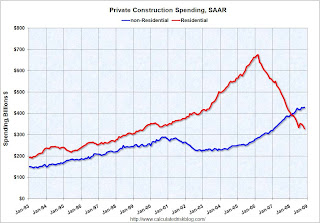 Construction Spending in November Construction Spending in November
This graph shows private residential and nonresidential construction spending since 1993.
Nonresidentialspending held up as builders completed projects. This showed up in theQ4 GDP report too (non-residential investment in structures was offonly slightly in Q4). From: Construction Spending Declines in November
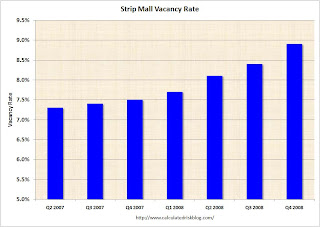 Strip Mall Vacancy Rate Strip Mall Vacancy Rate
REISreported: "At neighborhood and community shopping centers, the vacancyrate rose to 8.9 percent from 8.4 percent in the third quarter, thehighest since Reis began publishing quarterly data in 1999."
Thisgraph shows the strip mall vacancy rate since Q2 2007. Note that thegraph doesn't start at zero to better show the change. Strip mallvacancy rates are headed for double digits this year. From: Mall Vacancies Reach 10-Year High
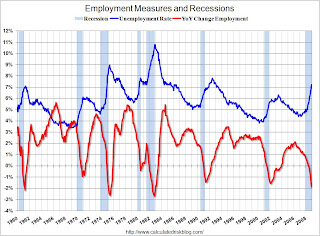 December Employment Report December Employment Report
Thisgraph shows the unemployment rate and the year over year change inemployment vs. recessions. The unemployment rate rose to 7.2 percent;the highest level since January 1993.
Nonfarm payrolls decreasedby 524,00 in December, and November payrolls were revised down to aloss of 584,000 jobs. The economy lost over 1.5 million jobs in Q4alone! From: Employment Declines Sharply, Unemployment Rises to 7.2 Percent
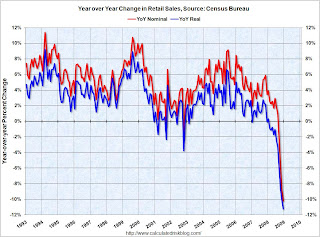 December Retail Sales December Retail Sales
This graph shows the year-over-year change in nominal and real retail sales since 1993.
Althoughthe Census Bureau reported that nominal retail sales decreased 10.2%year-over-year (retail and food services decreased 9.8%), real retailsales declined by 11.3% (on a YoY basis). This is the largest YoYdecline since the Census Bureau started keeping data. From: Retail Sales Collapse in December
 LA Port Traffic in December LA Port Traffic in December
This graph shows the combined loaded inbound and outbound traffic at the ports of Long Beach and Los Angeles in TEUs (TEUs: 20-foot equivalent units or 20-foot-long cargo container).
Inboundtraffic was 19% below last December. For the LA area ports, outboundtraffic continued to decline in December, and was 30% below the levelof December 2007. From: LA Area Port Traffic Collapses in December
 December Capacity Utilization December Capacity Utilization
Capacity utilization fell to 73.6% from 75.2%. This is the lowest level since December 2001.
The significant decline in capacity utilization suggests less investment in non-residential structures for some time. From: Capacity Utilization and Industrial Production Cliff Diving
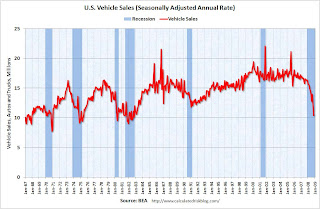 Vehicle Sales Vehicle Sales
This graph shows monthly vehicle sales (autos and trucks) as reported by the BEA at a Seasonally Adjusted Annual Rate (SAAR).
Thisshows that sales have plunged to just over a 10 million annual rate -the lowest rate since the early '80s recession. From: Vehicle Sales
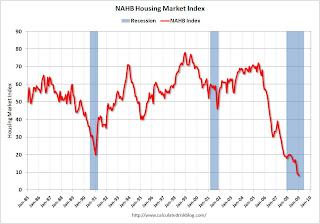 NAHB Builder Confidence Index in January NAHB Builder Confidence Index in January
This graph shows the builder confidence index from the National Association of Home Builders (NAHB).
The builder confidence index was at 8 in January, a new record low. From: NAHB Housing Market Index Falls to New Record Low
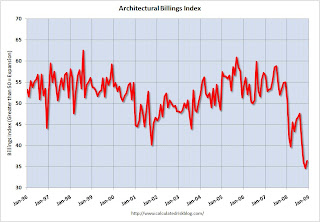 Architecture Billings Index for December Architecture Billings Index for December
TheAmerican Institute of Architects (AIA) reported the December ABI ratingwas 36.4, up from the 34.7 mark in November (any score above 50indicates an increase in billings).
From: Architecture Billings Index Near Record Low
 Vehicle Miles driven in November Vehicle Miles driven in November
Thisgraph shows the annual change in the rolling 12 month average of U.S.vehicles miles driven. Note: the rolling 12 month average is used toremove noise and seasonality.
By this measure, vehicle milesdriven are off a record 3.7% Year-over-year (YoY); the decline in milesdriven is worse than during the early '70s and 1979-1980 oil crisis. Asthe DOT noted, miles driven in November 2008 were 5.4% less thanNovember 2007, so the YoY change in the rolling average may get worse.From: DOT: U.S. Vehicle Miles Driven Declines Sharply
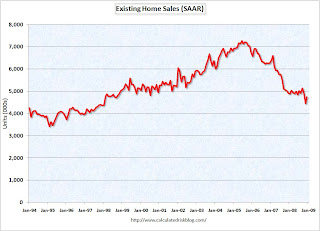 Existing Home Sales in December Existing Home Sales in December
This graph shows existing home sales, on a Seasonally Adjusted Annual Rate (SAAR) basis since 1993.
Salesin December 2008 (4.74 million SAAR) were 6.5% higher than last month,and were 3.5% lower than December 2007 (4.91 million SAAR). From: Existing Home Sales Increase in December
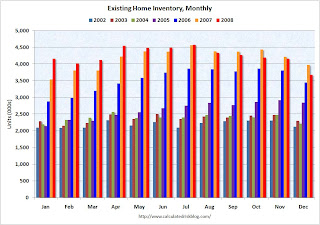 Existing Home Inventory Existing Home Inventory
Thisgraph shows inventory by month starting in 2002. Inventory levels wereflat for years (during the bubble), but started increasing at the endof 2005.
Inventory levels increased sharply in 2006 and 2007,but have been close to 2007 levels for most of 2008. In fact inventoryfor the last five months was below the levels of last year. This mightindicate that inventory levels are close to the peak for this cycle.From: Existing Home Sales (NSA)
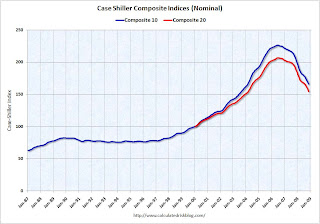 Case Shiller House Prices for November Case Shiller House Prices for November
This graph shows the nominal Composite 10 and Composite 20 indices (the Composite 20 was started in January 2000).
The Composite 10 index is off 26.6% from the peak. The Composite 20 index is off 25.1% from the peak. From: Case-Shiller: House Prices Fall Sharply in November
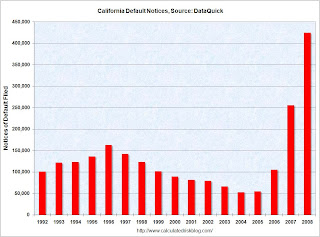 California Notices of Default California Notices of Default
This graph shows the Notices of Default (NOD) by year in California from DataQuick.
There were a record 423,962 NODs filed in 2008, breaking the old record of 254,824 NODs in 2007.
Theprevious record had been in 1996 with 162,678 NODs filed. That wasduring the previous California housing bust in the early to mid-90s.From: DataQuick: Temporary Drop in California Foreclosure Activity
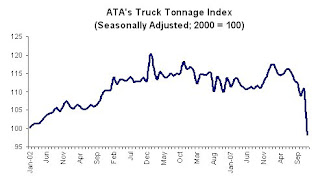 ATA Truck Tonnage Index ATA Truck Tonnage Index
"TheAmerican Trucking Associations’ advanced seasonally adjusted For-HireTruck Tonnage Index plunged 11.1 percent in December 2008, marking thelargest month-to-month reduction since April 1994, when the unionizedless-than-truckload industry was in the midst of a strike. December’sdrop was the third-largest single-month drop since ATA began collectingthe data in 1973." From: Truck Tonnage Index: Cliff Diving
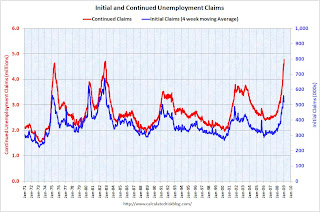 Unemployment Claims Unemployment Claims
This graph shows weekly claims and continued claims since 1971.
The four week moving average is at 542,500; still below the recent peak of 558,750
in December.
Continuedclaims are now at 4.78 million - a new record (not adjusted forpopulation) - just above the previous all time peak of 4.71 million in1982. From: Continued Unemployment Claims at Record High
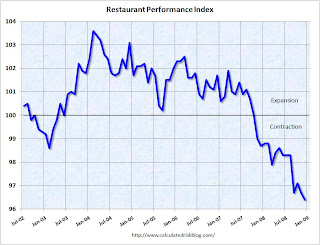 Restaurant Performance Index for December Restaurant Performance Index for December
"TheAssociation's Restaurant Performance Index (RPI) - a monthly compositeindex that tracks the health of and outlook for the U.S. restaurantindustry - stood at 96.4 in December, down 0.2 percent from Novemberand its 14th consecutive month below 100."
From: Restaurant Performance Index at New Low
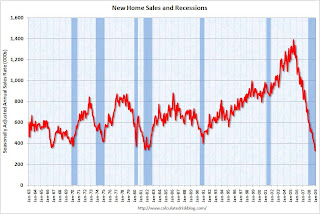 New Home Sales New Home Sales
This graph shows New Home Sales vs. recessions for the last 45 years. New Home sales have fallen off a cliff.
From: Record Low New Homes Sales in December |
|

 狗仔卡
狗仔卡 发表于 2009-2-1 04:23 AM


 提升卡
提升卡 置顶卡
置顶卡 沉默卡
沉默卡 喧嚣卡
喧嚣卡 变色卡
变色卡