Originally published July 13, 2016
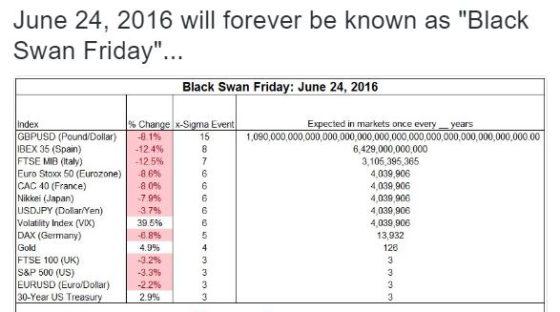
After every crash or major geopolitical event that roils the market we are exposed to graphics like this one containing sigma numbers:
The message associated with these charts is usually, "We should be very worried because the events that just occurred were really unlikely."
The reader, on the other hand
should be thinking: the person that wrote this really doesn't understand statistics or
Black Swans.
What is Sigma?
The common usage of the term "sigma" in statistics stems from the use of the lower-case Greek letter sigma to denote volatility. A standard deviation calculation is usually used to compute volatility, so sigma and one standard deviation have become interchangeable. A standard deviation is an always positive measure of how much variation there is in a data set. If the data doesn't move around much (e.g., daily high temperature in Hawaii) the standard deviation will be low. If the data moves around a lot (e.g., the CBOE's VIX), then the standard deviation will be higher.
The calculation (slightly simplified) of the standard deviation is not all that scary:
- Compute the average of the data set
- Subtract the average from every data point (which will give you both positive and negative differences) and then square it.
- Average the squared differences for all the data points, and then take the square root
Once computed the standard deviation provides a succinct way to describe how widely a specific data point differs from the average. For example, if the standard deviation of daily high temperatures in Hawaii is 4 degrees, then a cold day with a high 12 degrees below average would be a 3 standard deviation, or "3 Sigma" event.
Sigma and the Normal Distribution-Not Siamese Twins
The standard deviation calculation makes NO assumptions about how the data points are arranged around the average - what statisticians call the distribution. The standard deviation calculation does not assume, or require, that the distribution be normal (Gaussian) or any one of the many other different possible distributions (e.g., Laplace, Cauchy, Parabolic Fractal).
Unfortunately, even though there's no mathematical linkage between the standard deviation and the normal distribution, most people assume the two are locked together. For example, you may have heard of "6-sigma quality", which strives to achieve quality levels of fewer than
3.4 defective features per million opportunities. This percentage assumes a normal distribution - not a bad assumption for flaws in a complex manufacturing process. However if the distribution of failures happens to be Laplacian, then 6-sigma quality might exhibit 860 defective features per million-not such a great achievement.
Nassim Taleb in his book "The Black Swan" calls this tendency to assume the normal distribution the
Ludic Fallacy. He suggests this belief stems from people inappropriately extending the structured randomness of games and gambling into the real world processes where complexity and human psychology reign.
Financial Indexes are Typically Not Normally Distributed
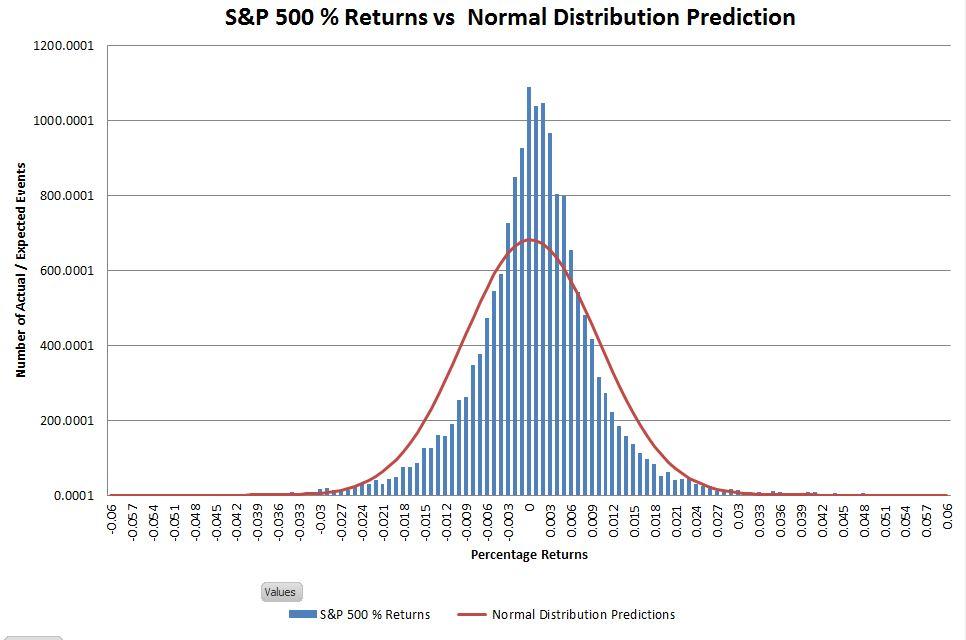
Most of the time variations in financial markets look like what you'd expect from a normal distribution. The chart below shows returns of the S&P 500 since 1950 compared to what the normal distribution predicts.
Although the central peak of the historic data is higher than the normal distribution, and the shoulders are a bit narrower, the match is usually considered good enough. Financial analysts usually assume the normal distribution because they are familiar with it and there's a rich tool set for it (e.g., Excel supports it directly with built-in functions). For typical situations it works well enough.
The Devil is in the Assumptions
If a process has 30 or more sub-processes or components within it and these components are independent from each other then it's very likely the distribution of that process will be normal.
While it's common for financial markets or metrics to have 30 or more components it's incorrect to assume they're independent - especially when emotions are running high. In very stressful times market participants abandon any pretense of independence and start moving in lockstep.
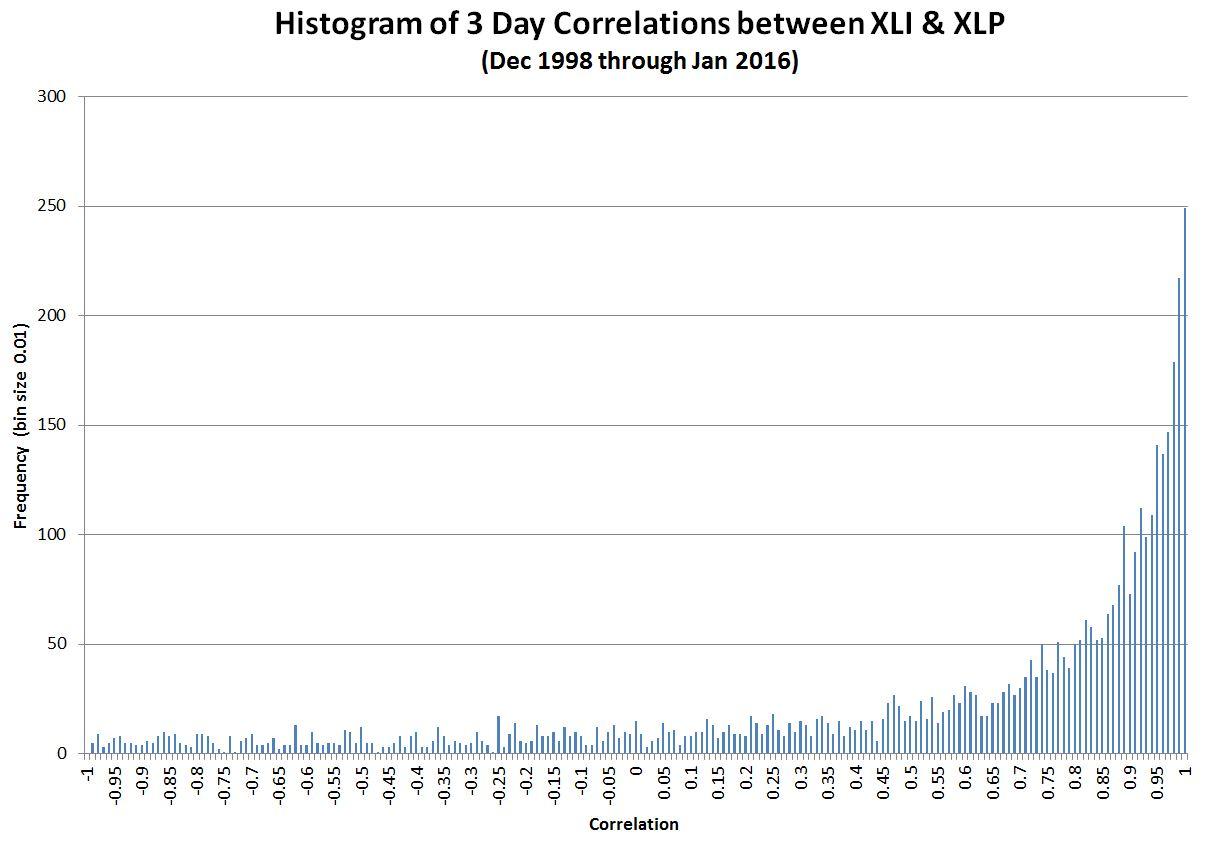
The chart below shows the correlation (a statistical measure of independence) between two exchange traded funds that track sectors in the S&P 500. A correlation of one means the sectors are in lockstep, a correlation of zero indicates they're independent.
As you can see the sectors are usually not independent. And as a result of these correlations, the S&P's returns are not normally distributed. Not only is the central peak too high, and the shoulders too narrow, but the tails of the distribution on both the positive and negative side (impossible to see on most histograms) are much fatter than the normal distribution.
So if the normal distribution is not a good match to financial returns which one should we be using?
Using the Laplace Distribution to Assess Probabilities
Mathematically it's pretty easy to come up with distributions that are better matches to the S&P's distribution than the normal, but it's not possible to prove which one is best - there's just not enough data to settle the matter.
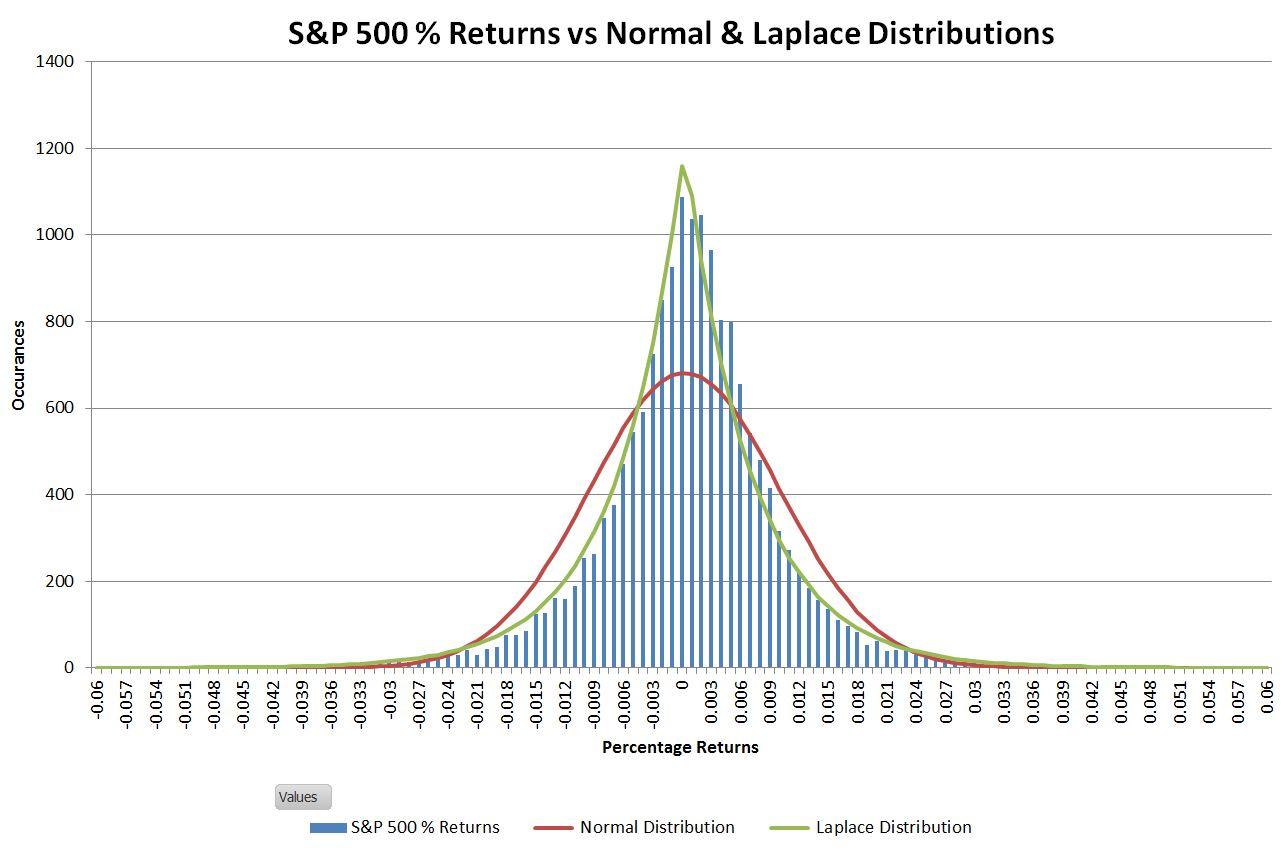
One distribution that works well is the Laplace distribution (which I describe
here). It has a good match to historical data and it serves to illustrate how different some distributions are from the normal. The chart below shows how the classic Laplace distribution is a better fit to the central peak of the historic S&P 500 data.
The big disconnects between the historic data and the normal distribution are in the tails. The table below shows the differences for a range of sigma levels. The "Matched Laplace" distribution used is one that's
tuned to better match the tails of the S&P 500 distribution.
Greater Than
Plus / MinusSigma Levels | Expected Frequency S&P 500 Matched Laplace | Expected Frequency Normal Distribution |
| >+-1 | 76 events per year | 80 events per year |
| >+-2 | 23 events per year | 12 events per year |
| >+-3 | 7 events per year | 0.7 trading events per year |
| >+-4 | 2.2 events per year | 0.016 events per year |
| >+5 | 7 events in 10 years | 0.0014 events in 10 years |
| >+-6 | 2 events in 10 years | 5×10⁻⁶ times in 10 years |
| >+-7 | 6 events in 100 years | 6×10⁻⁸ times in 100 years |
| >+-8 | 2 events in 100 years | 3×10-11 times in 100 years |
| >+-9 | 6 events in 1000 years | 6×10-14 times in 1000 years |
| >+-10 | 2 events in 1000 years | 4×10-18 times in 1000 years |
| >+-11 | 5 events in 10,000 years | 9×10-22 times in 10,000 years |
| >+-12 | 2 events in 10,000 years | 9×10-27 times in 10,000 years |
For sigma levels lower than four the normal and Laplacian distributions aren't dramatically different, but the expected frequencies diverge rapidly as we evaluate higher sigma levels. For events with sigmas as low as six or seven the normal distribution predicts their odds of occurrence as incredibly low. Even with the Laplace distribution the probability of a sigma event higher than seven or eight is unlikely in a lifetime.
Interpreting Sigma Events Above Seven
Common probability distributions predict that events with sigma levels above seven are very unlikely - and yet we see lots of them. I think the potential causes of these events fall into the following four categories:
- System Failures
- Externally Driven
- Low Liquidity Metrics
- Stuff Happens
System Failures (e.g., Flash Crashes)
The 2010
Flash Crash and the 1987
Black Monday Crash (21 sigma) were both system failures where the combination of flawed technology and run-away human emotion triggered unprecedented downswings. In both cases the market makers stepped away from the market during the worst times - exacerbating an already bad situation.
Everyday variations in markets can't be used to predict system failures - there's no connection between those variations and the things (e.g,. software defects, unanticipated interactions between subsystems) that cause system crashes. When systems do crash the obvious questions are how much damage was done, what was the root cause, and what can be done to prevent future failures.
While huge amounts of money are lost during these failures (at least on paper), some people benefit (e.g., Taleb made his
first fortune from the 1987 crash) and the long-term effects are often minor. Despite the 22% drop during the October 19th crash the 1987 market ended up with a small overall gain for the year.
Externally driven (e.g., Forex shocks, Bank Rates)
In 2015 when the Swiss National Bank stopped trying to cap the Swiss franc exchange rate to the euro the franc jumped 19% (
180 sigma) essentially instantaneously relative to the euro. The British pound dropped 8.1% (15 sigma) in the confusion after the Brexit vote. The everyday volatility of foreign exchange rate or an overnight interbank lending rate is clearly not a good predictor of the macroeconomic forces that ultimately drive those rates. It's like trying to use daily vibration levels in a car to predict auto accidents.
Low Liquidity Metrics (e.g., VIX, PE ratios)
The CBOE's VIX index is fertile ground for producing high sigma events. Prognosticators pore over
single and multiple day increases looking and often finding high sigma events useful for supporting their oft-repeated contention that the system is about to collapse. Not only does the VIX spike up frequently, it often collapses after emotions subside-offering even more high sigma events to work with.
A key characteristic of the VIX is that unlike stocks or currencies it is impossible to invest in it directly. The best you can do to follow the VIX is trade large quantities of SPX options spread over dozens, or even hundreds of strike prices. Things are further complicated by the fact that the VIX is calculated using mid prices, halfway between ask and bid prices, but real trades aren't constrained to trade at that point. Especially during times of market stress buyers must pay significantly more, and sellers get significantly less than the midpoint price.
Because there's not an easy way to hedge or monetize it, the VIX acts like a market with low liquidity. High demand during fearful times (usually for S&P 500 puts) rapidly drives up the index, and when the crisis has passed it collapses.
It hasn't happened yet, but I wouldn't be surprised to see a daily +100% move in the VIX (15 sigma). The index can get as low as 10 or 12 when the market is quiet and has averaged around 20 over the long term. A major geopolitical event / disaster after the VIX closes at a low level could quite conceivably result in the VIX opening in the 20 to 24 range - doubling in value and yet very close to its long-term average.
The VIX generates high sigma events when people rush to insure their portfolios and when they lose interest and wander off. This behavior offers entertainment value but is not particularly informative, and definitely not predictive.
Stuff Happens
Physicists have a saying: "If something can happen it will." Given enough time low probability events will happen.
Thirty-two consecutive reds occurred on a roulette table in 1943 - the odds of that happening are around 24 billion to one. However, I'm not aware of any high sigma financial event that is best explained as a truly random event. All the ones I've looked at appear to be explained best by one or more of the first three causes mentioned.
Are High Sigma Events Ever Predictive?
At least one high sigma event did foreshadow the 2008 meltdown - the 2007 jump in the 3-Month LIBOR OIS spread (
6-sigma). In Jack Schwager's book
Hedge Fund Market Wizards there's a fascinating interview with Colm O'Shea. When the LIBOR spike occurred (more than a year before the 2008 travails) O'Shea saw it as a clear signal of the beginning of the end for the housing / financial bubble and shifted his investments.
It's prudent to evaluate high sigma events as possible leading indicators of troubles ahead but recognize that virtually all these events reflect disruptions that have just occurred or are meaningless noise.
High Sigma Exhaustion
It's an inherent survival skill to notice unusual events. For a savanna dweller, an atypical movement in the savanna grass might be a snake or a lion - well worth some focused attention. In the same way, investors should be monitoring their financial environment for threats. But focused attention requires a lot of energy - always a scarce resource.
In the financial world attending to too many cries of "Wolf!!" will just leave us exhausted, paranoid, and vulnerable. We need to filter the cacophony of alerts/alarms we receive to determine real significance.
Specifically:
- Are probabilities being assessed correctly? Most financial processes are not normally distributed.
- Is the event a reasonable response to a system failure or a macroeconomic development?
- Is the new value extreme, or is it within historic ranges? If values remain within historic ranges it's likely that the damage isn't that severe.
- Is there an informed analysis showing the linkage between the event and real economic factors? If not, then you should suspect there's an ideology being pushed, often unaccompanied by any coherent economic analysis or any accountability on why an oft-repeated prediction is being rolled out once again.
Being Antifragile
Saving some energy by filtering will allow us to focus on what Taleb recommends relative to Black Swans - rather than try to predict them, figure out how to prevent them, or mitigate their effects. Build systems/portfolios that are tolerant of failures/unexpected events (Taleb calls systems with this attribute "
antifragile").
And probably most importantly, don't assume something won't happen because the computed probabilities are very low. Those computations often severely underestimate the true risk. We only need to look the failures of
Long-Term Capital Management and the collapse of the Mortgage Backed Security market in 2008 to see the impact of underestimating risk.

 狗仔卡
狗仔卡 发表于 2016-7-20 08:26 AM

 提升卡
提升卡 置顶卡
置顶卡 沉默卡
沉默卡 喧嚣卡
喧嚣卡 变色卡
变色卡 发表于 2016-7-20 09:24 AM
