
 狗仔卡
狗仔卡 发表于 2015-3-17 09:41 AM
Summary
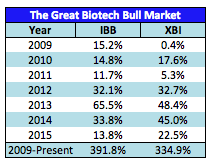
- The biotech sector is doing its best to prove everyone except the extremely bullish market participants wrong, as the IBB is already up 13.8% on the year.
- There is an 8.7% performance gap between the iShares Nasdaq Biotechnology Index ETF (IBB) and the SPDR S&P Biotech ETF (XBI) in first 2.5 months of 2015.
- I attribute the performance gap between IBB and XBI year-to-date (most of which has occurred since February 9th) to pricing concerns and a strong dollar.
- Since 2014, deals under $5B have a median premium of 53%, more than 20 percentage points greater than the median premium of 32% for deals over $5B.
- Given the differences that can occur in performance between XBI and IBB, it's important for biotech investors to consider what they invest in to appropriately determine the best benchmark.
Wow. For those like me that predicted biotech was due for a milder year of gains after the iShares Nasdaq Biotechnology Index shot up 33.8% in 2014, the biotech sector is doing its best to prove everyone except the extremely bullish market participants wrong, as it is already up 13.8%, with the year not even a quarter of the way over. When you look at this bull run over even a longer period, the results are absolutely astounding:
While the discussion on when this will end has been a heated one, with even Federal Reserve Chairwoman Janet Yellen jumping into the fray on the bear side in July 2014, I remain of the opinion that biotech remains a relatively attractive place to invest money in compared to other sectors and asset classes, as I stated in my primer for biotech in 2015. With that being said, biotech's current status as the "flight to safety" trade is not sustainable, and the sector will certainly will certainly experience some bumps along the way going forward.
One interesting aspect of performance that I would like to break down in this week's piece is the 8.7% performance gap between the iShares Nasdaq Biotechnology Index ETF (NASDAQ:IBB) and the SPDR S&P Biotech ETF (NYSEARCA:XBI) in the first 2.5 months of 2015.
IBB vs. XBI YTD
(click to enlarge)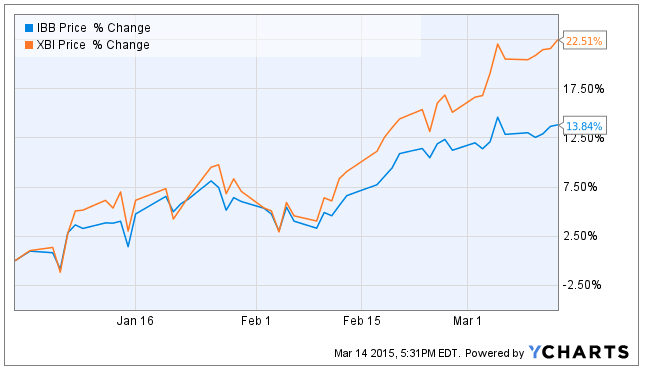
When looking at the daily chart for the year-to-date performance in more detail, we can see that the divergence only really began in mid-February, meaning the 8.7% performance gap was created, for the most part, in only the past 20-25 trading days:
IBB vs. XBI Since February 9th
(click to enlarge)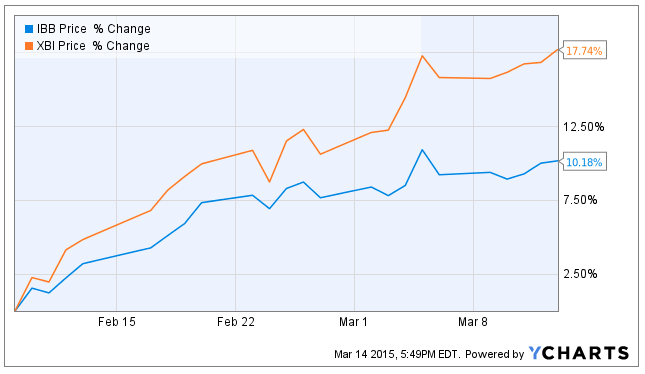
The main factor triggering this performance gap is small cap outperformance.
Small Cap Outperformance - To understand the significance that small cap outperformance has on the performance variation between XBI and IBB, it is first important to understand some of the major differences between the ETFs. Morningstar is a great place to start:
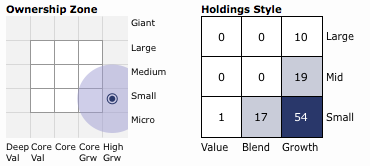
XBI Breakdown By Market Cap
IBB Breakdown By Market Cap
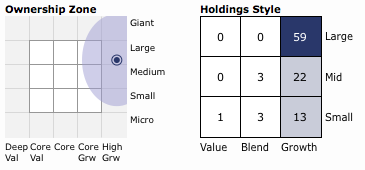
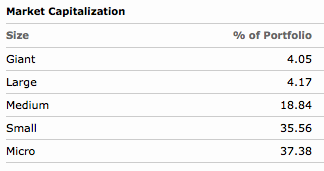
From the style box, we can see XBI is very heavily weighted to small cap names, while IBB is skewed to names with higher market caps:
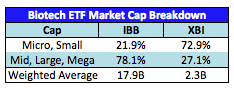
XBI is 72.9% small and mid cap, with only 27.1% mid, large, and mega cap, while IBB is 78.1% mid, large, and mega cap, with only 21.9% micro and small cap.
One of the main factors triggering this difference is the design of the two indices. XBI seeks to track the S&P Biotechnology Select Industry Index through a modified equal-weight strategy, meaning that it does not typically have concentrated positions. It looks to do significant rebalancing on the third Friday of the quarter-ending month (coincidentally this is this Friday, March 20th). IBB seeks to track the Nasdaq Biotechnology Index, but does so with very concentrated positions. The top ten positions in the ETF are skewed toward large cap biotechs and makes up 53.9% of the ETF, substantially higher than the 18.2% total weight for the top 10 of XBI.
A comparison of the top 10 stocks in each ETF is listed below:
(click to enlarge)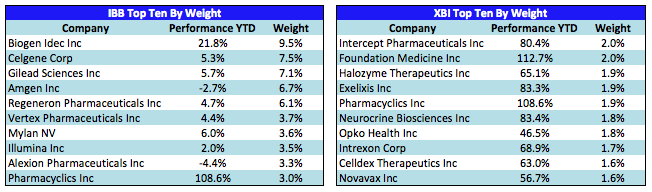
This theme of small cap outperformance has been seen throughout the overall market so far year-to-date, albeit with not as substantial a net difference as in biotech. The iShares Core S&P Small-Cap ETF (NYSEARCA:IJR) ($1.5B weighted average market cap) has outperformed the SPDR S&P 500 ETF (NYSEARCA:SPY) ($73.5B weighted average market cap) by 2.0% since February 9th, when we began to see the difference in performance between IBB and XBI. The difference is even more evident when looking at the iShares Micro-Cap ETF (NYSEARCA:IWC) ($0.5B weighted average market cap), which has outperformed the SPY by 4.07% since February 9th.
IWC vs. IJR vs. SPY YTD
(click to enlarge)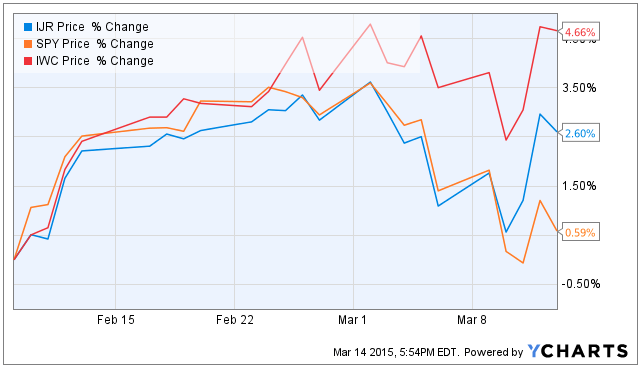
While I do think that some of the variation between IBB and XBI is due to macro factors, there are some factors within the biotech industry specifically that have caused this variation. The main factors (both macro and industry-specific) contributing to the large variation between the two most popular biotech ETFs that I would highlight include:
1. Pricing Concerns
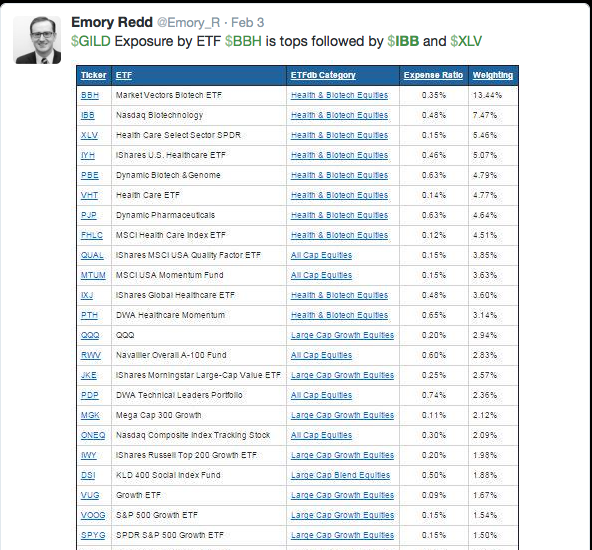
While acknowledging that IBB has significantly outperformed the SPY so far this year (13.8% vs. 0.1%), I believe that one of the main reasons IBB has lagged XBI are concerns related to how pricing will affect profits. Pricing concerns had recently come to the forefront of attention for biotech investors, when AbbVie (NYSE:ABBV) announced it agreed to significant pricing concessions as part of an exclusive deal with Express Scripts (NASDAQ:ESRX) for the company's hepatitis C therapy. This worry intensified in February with Gilead's (NASDAQ:GILD) corporate update on February 4th, when the company announced that discounts for its hepatitis C treatments, Harvoni and Sovaldi, would increase to an average of 46% 2015, up substantially from 22% in 2014. This steep deep discount increase came as a shock to investors, with RBC Capital analyst Michael Yee stating that the discount was much "higher than consensus of 25 to 30 percent or so." Sanford Bernstein analyst George Porges was shocked, as Gilead had been "fairly outspoken about its ability to maintain price due to its differentiated product and strong position with physicians." Gilead dropped more than 8% on the day of the news. This news pretty closely aligns with the beginning of the divergence of XBI and IBB, and I believe it is a factor that has been weighing on some big biotechs like GILD with specialized treatments that they believed might give them pricing power - yet, some of the power has now shifted to the PBMs. While pricing is a huge concern for the large biotechs generating substantial revenue that are very concentrated positions within IBB, it is of much less concern for the smaller companies making up XBI, many of which are years away from having a significant revenue stream. To highlight the lack of large cap exposure (and specifically, Gilead) in XBI, take a look at this helpful post courtesy of Emory Reed (@Emory_R on Twitter) that breaks down Gilead exposure by ETF. While you'll see IBB near the top of the list, with Gilead at a 7.5% weighting, you'll notice that XBI is not even listed (currently, Gilead makes up only 0.9% of XBI).
GILD Exposure by ETF (As of February 3rd)
2. A Strong Dollar
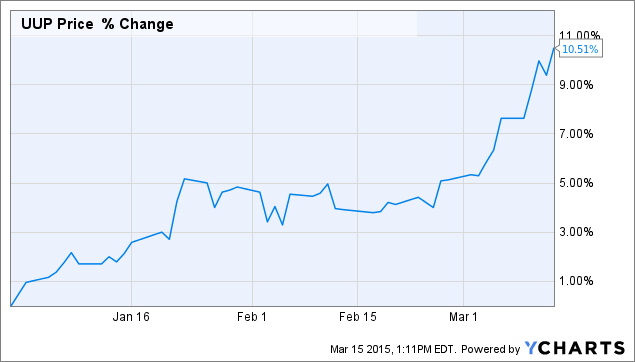
Dollar strength has been an underappreciated theme throughout the investment community, as many are finally realizing the large negative effect it will have on the earnings of companies with significant operations overseas. Pfizer (NYSE:PFE) announced in late January that its earnings would be hurt by a strong dollar, saying there would be a negative impact of $2.8 billion due to "recent adverse changes in essentially all foreign exchange rates relative to the U.S. dollar." While the dollar did show strength in the back half of 2014, it has continued to show substantial strength in 2015. The PowerShares DB USD Bull ETF (NYSEARCA:UUP), which tracks the changes in the Deutsche Bank Long US Dollar Index (USDX) Futures Index - Excess Return, is already up 10.5% in the first 2.5 months of the year and more than 6% since Pfizer's warning.
While this will negatively affect large cap names with significant revenues from overseas (including Gilead, which had foreign income before taxes of $8.2 billion in 2014), small cap names with revenues mainly from the U.S. (or the case of many small bios, no current revenues and just projected future revenues) are not negatively affected by the dollar strength.
3. Higher Buyout Premiums for Small Caps
To discuss the theme of higher buyout premiums in smaller deals in the biotech space, I have gathered data on all deals in the space with a public company involved, courtesy of DewDiligence on InvestorsHub (@DewDiligence on Twitter):
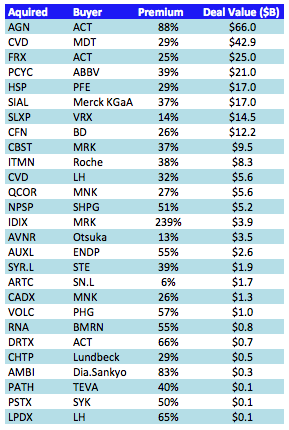
Looking at the summary statistics sheds a little light on this theme:
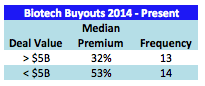
While I am typically more of a fan of average as opposed to median, median is the appropriate summary statistic for this type of analysis, as high premiums (such as Merck's (NYSE:MRK) buyout of Idenix (NASDAQ:IDIX)) would skew the average, but will not skew the median. From this data of buyouts in the space from 2014 to the present, we can see that deals valued under $5B have a median premium of 53%, which is more than 20 percentage points greater than the median premium of 32% for the greater-than-$5B deal group. While this is not necessarily an absolutely huge factor in the performance variation between XBI and IBB since February 9th, it is a factor that will provide XBI with higher returns over time.
A Comment on Benchmarking
Before wrapping up, I wanted to use this piece as an avenue to comment on benchmarking your biotech portfolio. Everyone (including myself) is always quoting performance figures for IBB. Using my portfolio for the 2015 Biotech Charity Contest is a great example (I discuss this in more detail here):
(click to enlarge)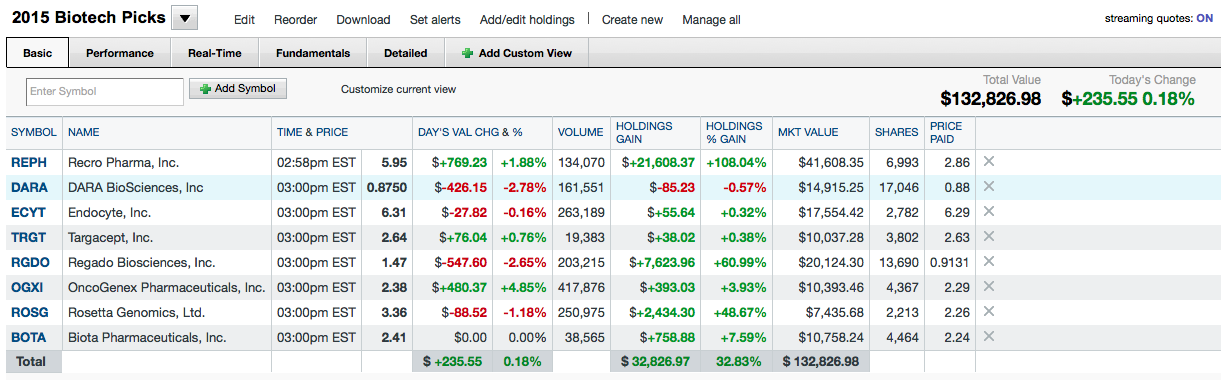
I was excited to see my portfolio for the charity contest beating IBB by almost 20% (32.8% vs. 13.8%), thanks to a nice 80.9% move last week by Recro Pharma (NASDAQ:REPH) on the announcement of a deal with Alkermes (NASDAQ:ALKS). While that sounds great, that is probably not the most accurate comparison. Take a look at the market caps of my picks:
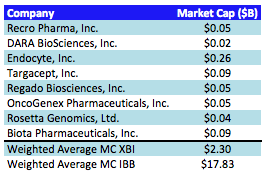
While you certainly can (and probably should) look at multiple statistics to determine the appropriate benchmark, a quick look at the market caps of my picks illustrates IBB is likely not the appropriate benchmark, and I should considering using XBI instead (maybe I should look for an even more microcap-type ETF).
While the performance of my charity portfolio still looks respectable versus XBI (32.8% vs. 22.5%), there is not as huge of an outperformance, and this is likely the better way to look at things. As a simplified blanket rule, I would say biotech investors looking mainly at names in the $5B and less range should give consideration to using XBI for benchmarking purposes as opposed to IBB.
Conclusion
Biotech has exhibited impressive strength so far in 2015. It is interesting to note the large performance difference between XBI and IBB so far this year, which has mainly taken place in the 5-week period since February 9th. Concerns in regard to pricing power for breakthrough treatments and a strong dollar are two of the main factors that I believe have helped provide XBI with superior performance. Small cap names will have higher buyout premiums, which is another factor to consider. Given the differences that can occur in performance between XBI and IBB, it's important for biotech investors to consider what they invest in to appropriately determine what would be the best tool for benchmarking.
 提升卡
提升卡 置顶卡
置顶卡 沉默卡
沉默卡 喧嚣卡
喧嚣卡 变色卡
变色卡