|
|
本帖最后由 bayliner1979 于 2009-10-21 17:40 编辑
No Country for Old Jobs: 10 Charts Showing the Fragile Recovery. Home Sales, Buying versus Renting, Unemployment, and Real Economy Data
No country can go on spending more than they earn and expect sustained prosperity. Sure, they can get away with a façade of economic stability glazed over by copious amounts of debt but eventually the piper must be paid. The U.S. Treasury in combination with the Federal Reserve has made the ultimate bet that by forcing the dollar lower and injecting easy money into the economy that somehow it will jumpstart the economic engine. If we examine multiple levels of economic activity we are yielding very little overall for trillions of dollars in bailout funds. The big winners here are the banks and the American public is still waiting for the real recovery in the economy.
It is disturbing that there is a significant school of economic thought out there that somehow jobs do not matter. This line of reasoning is baffling. In many ways, this is similar to the collective deep capture that occurred during the housing bubble that somehow prices were justified even in the face of rampant fraud and mass delusion. They don’t call it mania for nothing. Take for example the wonderfully unstable budget of the biggest state of our country, California.
Only last week, State Controller John Chiang announced that the state is falling behind $1.1 billion in receipts from a budget only enacted three months ago. Keep in mind the estimates made only a few months ago were conservative by California standards yet somehow money isn’t coming in. This is occurring at the same time that the state has hiked taxes and is also front loading tax collections earlier. To the obvious person on the street, you cannot tax someone without a job. Well, that isn’t necessarily true because you can tax them on items they buy (in some counties like L.A. that rate is near 10 percent).
We are now 21 months into this recession. Job growth is no where on the horizon. It would appear that people are waiting for some ambiguous industry to emerge out of the ashes like some financial Phoenix. Will it be the green sector of our economy? Yet even in that optimistic scenario, does that sector have enough to make up for the 8 million jobs lost in this recession and the growing demands from a larger work force? If we examine eras like the 1920s in Florida and their real estate bubble, prices did not come back for years. So if you factor in the 1920s coupled with the Great Depression of the 1930s, things didn’t turn around for nearly two decades. California and Florida are coming off unsustainable highs. What does this mean? Let us go back to the State Controller report. What that translates to in the real economy is less money coming in to the government. And that means either more tax hikes or more spending cuts.
Let us take a look at a sign of economic vitality. U.S. Exports:
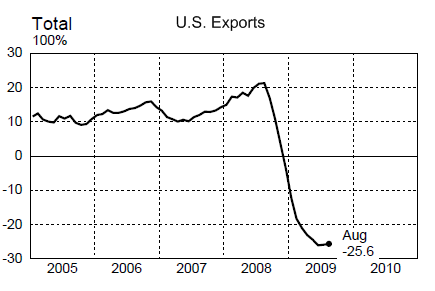
Source: Federal Reserve
Does that chart look like a recovery to you? Keep in mind the above chart factors in every imaginable bailout and trillions funneled into the financial sector. Yet exports haven’t moved. Before we can talk about housing rebounding and moving upwards shouldn’t we talk about the real economy first?
In this article we are going to examine 10 charts from housing to auto sales that show not much has changed at the core of the economy.
Chart 1 – Auto Sales
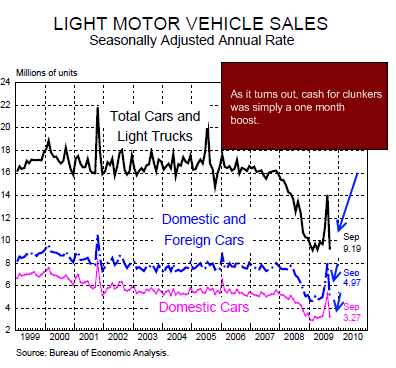
As it turns out, cash for clunkers was merely a way to frontload auto sales. After seeing a spike in August sales the September number fell back to the year long trend. As one colleague told me, we helped stimulate the foreign auto maker market since most of the cars bought were non-domestic in brand. Talk about a horrible strategy. Given that we now own GM and Chrysler making the U.S. government auto CEO, why would you want to reward your competitor? Seems like our politicians don’t think things through because a one month boost came with an expensive price tag.
And is this even the right way to go? Again, non-domestic auto makers make up a big part of our economy even though many provide jobs outside the U.S. I’m all for open trade. But why is the American taxpayer subsidizing this? As we had speculated back when the cash for clunkers program was announced, this was a big gimmick like Hope Now and other policies that have yielded poor results in action.
Chart 2 – Housing Starts
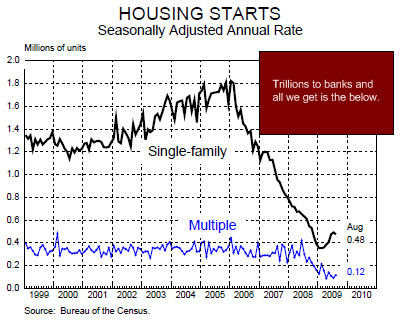
This chart should tell you the big story regarding home building. Sure, single family building is up a bit but wouldn’t you expect that with trillions being funneled into this industry? But look at the chart closely. Notice the multiple housing starts? Still at record lows. Why? Because the market is saturated with inventory! So trying to spur more building when we are seeing some 300,000 distress actions on homes hitting the market each month just doesn’t make sense. If anything, it will prolong this housing slump.
Housing starts have fallen so hard that we have to go back to the Great Depression to find another similar trend. It would seem that those calling bottom somehow believe that we are heading back to those 2005 and 2006 points. We are not. In their mind, everything is boom and bust. No middle ground is allowed. Let us assume we are back on normal ground. Then what? Why rush to buy a home now? If we are back on normal footing then housing should reflect employment conditions. After all, most Americans pay their mortgage from wages. So until employment and wages move up, there is little rush to purchase a home right now and later charts will highlight why.
Chart 3 – Single Family Home Sales
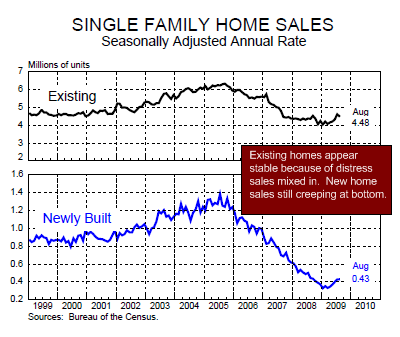
The stabilization with home sales is largely due to the big amount of distress sales going for rock bottom prices. Couple this with the Federal Reserve buying agency debt and keeping mortgage rates at historical lows and home buying conditions seem prime. Add fuel to the flame with an extremely expensive $8,000 tax credit and sales go up. It is simple. Just like cash for clunkers. Yet what happens when you remove that tax credit? Cash for clunkers gives us a crude look at what will happen.
And look at new home sales. They are off their lows but nothing remotely close to their peak days. So this chart ties in with the previous chart because all the action is in the existing home market. No need to build homes when people are buying and selling already made homes. So much for those construction jobs.
Chart 4 – 30 Year Mortgage Rates
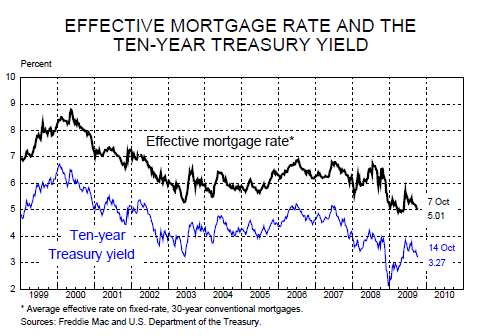
If you look at the chart above you can thank the Federal Reserve and U.S. Treasury. What you don’t see is the parallel destruction of the U.S. dollar for these cheap mortgage rates. There is no free lunch. Mortgage rates are near historical lows. Rates hovering at 5 percent don’t even mesh with historical standards. Over the past 40 years the average 30 year fixed rate has averaged 9 percent. That is, if we even revert to the mean rates will double meaning the amount people pay on a monthly basis will explode.
With Alt-A and option ARM loans not even eligible for these rates, how does this help distressed owners? It doesn’t. The market is artificially being juiced with trillions of dollars and at some point, something has to give. The Fed is betting the economy will miraculously find some other bubble (i.e., technology, real estate, ?) and will expand again. Yet we may be out of bubbles for the short term.
Chart 5 – Personal Savings Rate
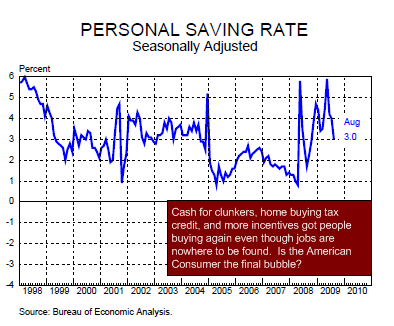
Americans started saving at a pace not seen in decades. Yet the cash for clunkers program and the home buying tax credit once again got people out and buying. But is this sustainable? It is too early to tell. The recent dip is because of these last two programs. The next phase will be the holiday shopping season. Many retailers depend on the November and December months for a large chunk of sales. We will soon find out how tapped out the average American is. Last year, people went out shopping like crazy even though economic indicators were equally poor.
Yet over this year, credit card companies have been yanking lines in light of higher default rates. Without the plastic, will Americans shop till they drop this Christmas?
Chart 6 – Hours Worked
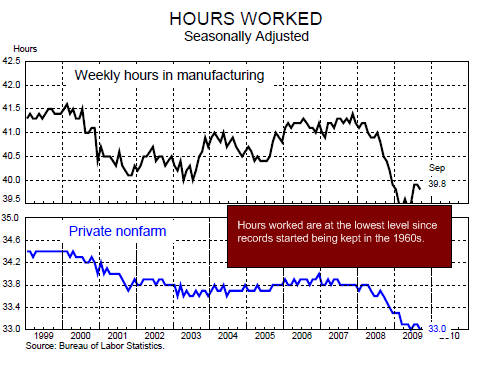
The work week has gotten shorter. So short, that it is the lowest it has been in record keeping history dating back to the 1960s. The average American work week is now down to 33 hours. Keep in mind this is for the employed. If we look at the under utilization rate (includes fully unemployed and those working part-time for economic reasons) the U-6 rate is up to 17 percent. The above chart reflects those but also those who supposedly have full-time jobs.
What is occurring is overtime is being cut and furloughs are being implemented like the 200,000 state workers of California that are now earning less. Earning less means less money to spend. The state is learning this lesson quickly. Jobs absolutely matter. The problem is Wall Street has captured our political process and convinced many that if Wall Street is happy, somehow little crumbs will trickle over onto Main Street and all will be well. So far, politicians have given everything the bankers have requested and nothing has changed on the streets of America. How is TARP working out?
Chart 7 – Household Debt Burden
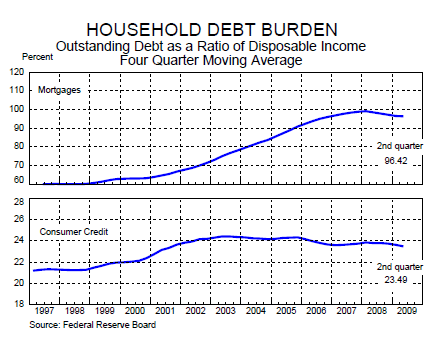
Even as debt is being destroyed through foreclosures and bankruptcies, many households are still in record amounts of debt. Why? Because losing jobs and less pay reflect a new reality even though the system is washing out old obligations. Debt is not wealth as many are now realizing.
This above chart may show why the American consumer is reluctant to go out and spend without getting massive incentives like cash for clunkers and home buying tax credits. Are we now going to give Americans a $1,000 holiday shopping voucher? Some in the retail sector have asked for similar goodies. Make no mistake that the crony bankers will ask for anything to fluff their own profits.
Chart 8 – Household Debt Service
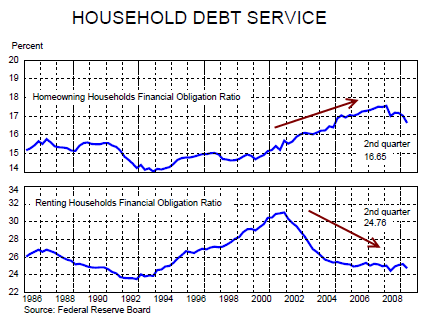
Now the above is a fascinating chart. What we see is a trend of less financial obligations for renting households. Rents have been falling across the country. This only makes sense since people are earning less. However, the financial debt obligation of homeowners is still near peak levels. Same amount of debt on a home that has seen equity evaporate.
Many people are now unable to qualify to buy a home and that is okay. We need to remember that during the bubble anyone with the desire to own was given that opportunity. Alt-A and option ARM products were the mortgage of choice for many. We are dealing with the repercussions of those decisions even today. In fact, we have yet to deal with them since 2010 to 2012 will bring many of these home loans to roost.
Chart 9 – S&P 500 Double Bubble
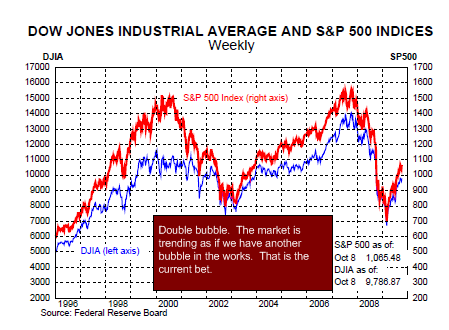
The above is perfect chart of the double bubble we have experienced in the last decade. It is interesting to see the recent trend as if a triple bubble is in store. The market is trending as if we will have a V shaped recovery. As we have seen with all the data above, if anything the cliff diving has stopped but this does not equate to a booming recovery. We are betting on another bubble even in light of no job growth and also trillions in bad loans coming due soon including commercial real estate.
The market price/earnings ratio is still high. It believes that 2010 will somehow bring back a 2005 year. But digging beyond the debt, 2005 wasn’t a stellar year. The only reason it looked stellar was the mania in housing and absurd financial sector profits. The financial sector profits are back with taxpayer money but the boom in construction is nowhere to be found. Unemployment is also officially nearing 10 percent.
Chart 10 – Health Care Employment
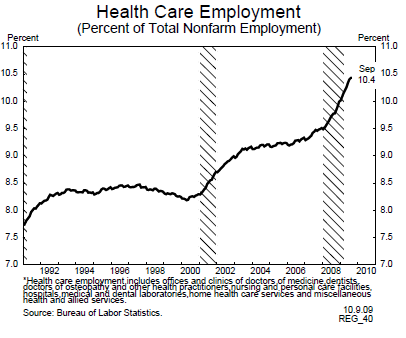
Maybe the next bubble is in healthcare? This chart tells you the story of an aging population that doesn’t make much anymore since it has outsourced a gigantic portion of its manufacturing base. Many younger workers are looking at boomers who lived up the 1960s and 70s, got serious in the 1980s and 90s and now are expected to shoulder the burden of their entitlements all the while understanding that they will not have those benefits when they retire. If anything, just look at the ages of those on Wall Street. The young brokers were merely fodder in the recent downturn as we saw these young Gordon Gekkos walking out of places like Lehman Brothers brown box in hand with desk goodies and a sad look on their face. Yet their bosses made out with millions in bonuses. So much for company loyalty.
Healthcare costs are growing and so is this part of our economy. With many boomers retiring in the next few years, an inordinate amount of stress will be put on our system. Younger generations are not having gigantic families anymore. So there are fewer people paying into the system for an enormous size of our population who will now start collecting. Social Security is minimal with average payments around $1,000 to $1,300 a month.
Yet younger workers are looking at this and also seeing these workers with pensions of $4,000 to $6,000 per month (and higher) and are now told to put their money into the 401k casino and hope it makes out because Social Security will be a shell for them when their time comes. Many have lost thousands in this recent crash that was the deepest since the Great Depression.
I doubt healthcare will be the next boom. This is a cost to our economy that is only set to go higher as people retire. What is the boom going to be in? Viagra? With annual sales of over a billion, maybe this is the boost the economy needs. I mean is this what it now boils down to? We need to get back to making things. The economy for much too long depended on youngsters in front of Bloomberg terminals punching in keys and trading billions of dollars as if it were the new version of Halo. Then the “real economy” was largely based on everyone dressed up in a suit pretending they were the next HGTV flip this house expert and trading homes like baseball cards. It was so easy. Paper pushing and house flipping. Heck, at least in the technology bubble we were left with some great companies. What are we left with after this housing boom? Gigantic McMansions for families that don’t even plan on having that many kids.
Until jobs start showing up, any talk of a rebounding housing market is moot especially with this entire artificial stimulus still bouncing around the economy. And collapsing tax revenues are not a good sign. I don’t buy the jobless recovery argument and the government tends to agree. If all is well, why is the U.S. government and Fed buying $1.25 trillion in agency debt to lower mortgage rates, putting in place an $8,000 tax credit, boosting car sales with gimmicks, encouraging risky low money down loans with FHA insured products, and extending unemployment insurance to a record 92 weeks in states like California? Do these things sounds like policies of a booming economy?
http://www.doctorhousingbubble.c ... -real-economy-data/ |
评分
-
5
查看全部评分
-
|

 狗仔卡
狗仔卡 发表于 2009-10-21 04:38 PM
 提升卡
提升卡 置顶卡
置顶卡 沉默卡
沉默卡 喧嚣卡
喧嚣卡 变色卡
变色卡


