Here is the second installment in my “Elliott Wave Cheat Sheet” mini-series. This post will discuss proper fractal wave labeling within a developing Wave Structure on all timeframes.
First, we understand that the principle is fractal, meaning a complete five-wave impulse up might just simply be part of Wave 1 or Wave 3 (or Wave 5) of a larger complete wave structure, which itself might be part of an even larger wave structure.
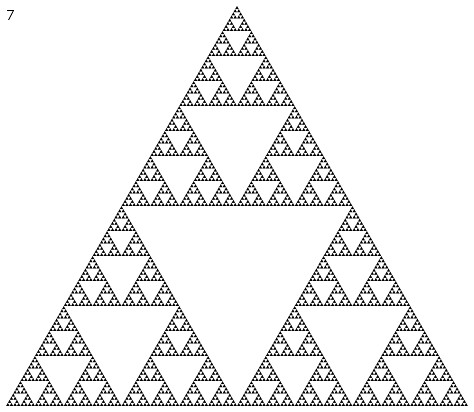
This image of the Sierpinski Triangle should give a visual image of how to visualize Elliott Waves as smaller and larger fractals making up a full picture:
This image from Flickr (via Meister Schlauch) shows how the complete, singular triangle is actually comprised of four identical triangles (look very closely - three filled in triangles are pointing up while a clear/hollow triangle is pointing down). And if you look at one of the filled triangles, you’ll see the exact same repetition, just on a smaller scale. And if you look inside one of the filled triangles of that fractal, you see the exact same pattern that comprises the whole, singular triangle one degree higher.
This is how to understand Elliott Wave Fractal ‘waves within waves.’
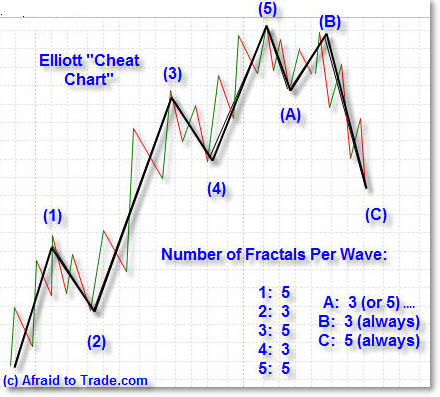
Refer back to my original “Cheat Sheet” to see a full Elliott Wave structure and the mini-waves that build up the larger waves.
Here is how to label most waves you’ll encounter if you’re not a deep-level Elliottician:
Most likely, you won’t go above the Primary Trend or below the Minute trend on a singular chart, so this simple guide should be sufficient.
The largest wave would be circled, one degree lower would be placed in parenthesis, one degree lower would be a normal number (or letter), and then one degree below that (usually intraday) would use the Roman Numerals.
It goes without saying that, while this is the proper and accepted guideline, it’s common to see various counts depending on the analyst, but Elliott purists would consistently use this methodology.
This way, if you’re trying to read an Elliott Wave forecast, you’ll know the logic behind why the analyst used the labeling system he or she chose.
Here is an example of proper fractal wave structure labeling on the S&P 500:
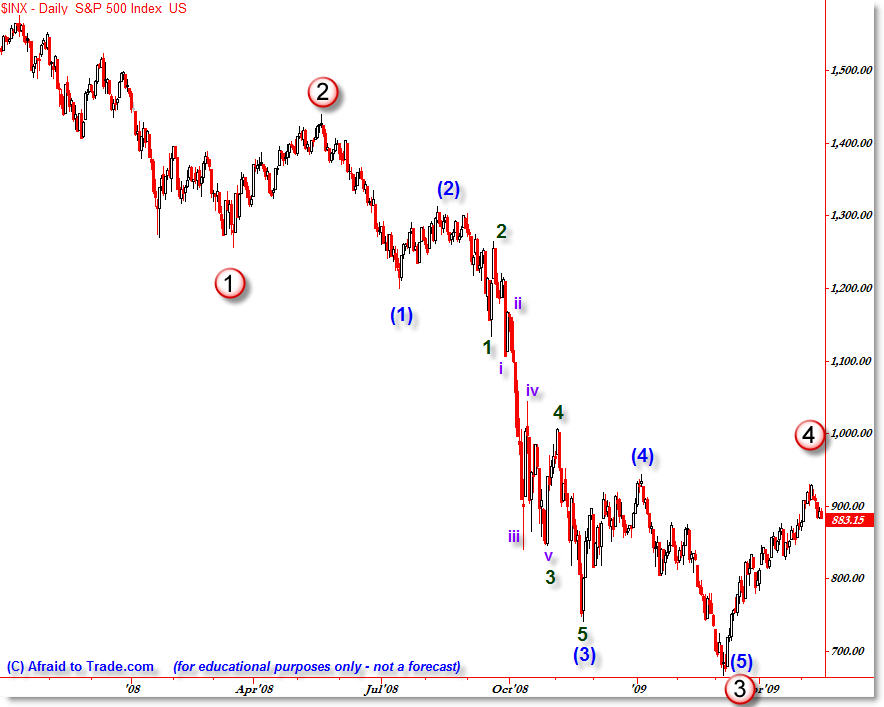
(Click for larger image - for educational purposes only - not a market forecast)
As mentioned earlier, the 3rd wave will subdivide into its own 5-wave structure. However, each wave of the 3rd wave subdivides into its own 5-wave affair. I’m only labeling the 3rd wave of each respective fractal down to four degrees of a fractal count to show you how waves subdivide within waves, and to show how to label (or interpret) different degrees properly.
Play with it until you understand the concept. If anything, this will give you a leg-up on others when you start looking at all those numbers and letters on your next Elliott Wave chart!
Keep checking back for more quick Elliott cheat sheets.
Corey Rosenbloom, CMT
Continuing my series of brief educational posts on “Elliott Wave Cheat Sheet” facts, the third installment describes the “best trades” theoretically you can take within a developing Elliott Wave structure.
Refer back to the First Elliott Wave Cheat Sheet: Introduction and then the Second Cheat Sheet: Wave Labeling.
While these might seem counter-intuitive, look really closely at these low risk, high probability opportunities as they develop. Many people who use Elliott Wave do so for key “Sweet Spots” rather than count endless waves incessantly. They’re just looking for a “Third of a Third” or to get short after they think they see a complete 5-wave structure. Use Elliott Wave however you see fit and however it works for you - just like any of the hundreds of technical indicators out there.
The following chart shows the “ideal” trades one can take from a developing Elliott Wave structure:
First, let’s assume that we’re coming off a downtrend, or that the first green arrow up begins after a C wave down has completed. For quick reference, in order from left to right, Wave 1 is up; Wave 2 is down; Wave 3 is large up; Wave 4 is down; Wave 5 is up; Wave A is down; Wave B is up; Wave C is down - I didn’t label them in the chart to keep it from being cluttered.
Many proficient Elliotticians may disagree with me, but I believe it is either impossible or very, very difficult to ‘predict’ or label a first and second wave in real-time - especially for beginners. Elliott Wave becomes much easier once you see a large impulse - which is most likely Wave 3 - and then look backwards and see “Ok, I think I see Waves 1 and 2.” Once Wave 3 is in place, the rest of the ‘map’ is easier. There’s no guarantees, but it’s helpful for anticipating.
Wave 3’s power comes from shorts covering and longs getting aggressive - a ‘point of realization’ occurs… also known as a “Sweet Spot.” Aggressive traders can jump on board there as a trend changes from down to up. Though profitable, this is very difficult in real time.
The way I use Elliott Wave intraday and on shorter time frames is to recognize a large impulse and then wait to buy the first pullback into support. Maybe there will be divergences or price will pullback to a key Fibonacci ratio or a moving average. I don’t yet have a name for it but you’re trying to “Buy at the Bottom of Wave 4 and Trade Wave 5.”
This is a “Pro-Trend” trade and often subdivides into five fractal waves.
The top of the 5th wave often forms a momentum (or volume) or TICK (intraday) divergence into the highs, so it’s often low risk just because of that formation. Once you believe the “5th wave” has completed itself - it takes experience - then exit your long and flip short for an aggressive counter-trend trade.
If you miss the first opportunity, wait for Wave B to rise up and fail to make a new high and then enter short on that pullback. Often, the top of Wave B will form a Cradle Sell Trade and lead to a powerful Wave C trend reversal back down.
Without getting too detailed, here are the key trades to take as you perceive a possible 5-wave structure forming on any timeframe:
Buy as price crests above Wave 1 (this is during wave 3)
Buy as price comes into support after a large impulse Wave 3
Sell Short as price crests with divergences into the peak of Wave 5
Sell Short as price rises but fails to make a new high at the Peak of Counter-Wave B
Additionally, via special agreement, you may view 10 Free Lessons on the Elliott Wave Principle as taught by Robert Prechter by joining Club Elliott Wave International.
Corey Rosenbloom, CMT | 
 狗仔卡
狗仔卡 发表于 2009-5-13 06:44 PM
 提升卡
提升卡 置顶卡
置顶卡 沉默卡
沉默卡 喧嚣卡
喧嚣卡 变色卡
变色卡